Enhancing Performance in Microservice Architecture with Kitex
Projects:

Kitex: Enhancing Performance in Microservice Architecture
Introduction
The team at ByteDance initiated the creation of the Remote Procedure Call (RPC) framework, Kitex, alongside several related fundamental libraries in 2019. This endeavor originated from confronting functionality and performance challenges within our extensive microservice architecture. We also wanted to combine the knowledge and insights gathered from previous frameworks. This development project was officially released for open-source contribution on GitHub in 2021.
From 2019 to 2023, our internal microservices have seen substantial growth. During this period, the Kitex framework has undergone numerous cycles of optimization and testing to enhance its performance and efficiency. In this article, we share performance optimization techniques that we’ve systematically implemented over the past few years.
The Evolution and Status Quo of Kitex
Understanding the Need for an RPC Framework
Although the Remote Procedure Call (RPC) framework has a long history, its wide-scale use as a crucial component aligns with the advent of microservice architecture. Therefore, it’s vital to revisit its historical developments and comprehend why an RPC framework is necessary.
Background: Monolithic Architecture Era
In this era, system services exhibited the following features:
Distinct business logic was categorized via functions.
The performance pressure was on the database, prompting the evolution from manually distributed databases to an automated distributed structure.
A typical business coding model during this period looked something like this:
func BuySomething(userId int, itemId int) {
    user := GetUser(userId)
    sth := GetItem(itemId)
}

func GetUser(userId) {
    return db.users.GetUser(userId)
}

func GetItem(itemId) {
    return db.items.GetItem(itemId)
}
This style of coding is straightforward, especially once built on top of a well-structured design pattern, can make it straightforward to refactor and write unit tests. Many IT systems still operate using this architecture.
However, as online businesses rapidly developed, we encountered the following limitations in some of the larger internet projects:
There’s a limit to computational power: the maximum computing power of a single request is less than or equal to the total computational power of a single server divided by the number of requests processed simultaneously.
There’s a constraint around developmental efficiency: the growth of the code repository, team size, and code complexity do not have a linear relationship. This makes maintenance incrementally more challenging as the business grows, resulting in a more complicated online implementations.
The Shift: Microservice Architecture Era
To overcome the issues inherent in the monolithic architecture, the IT community embarked on a journey into the era of microservice architecture. Here’s an example of typical code used in a microservice architecture:
func BuySomething(userId int, itemId int) {
    user := client.GetUser(userId) // RPC call
    sth := client.GetItem(itemId) // RPC call
}
RPCs (Remote Procedure Call) allows business systems to call remote services as though invoking local methods. This reduces the complexity of understanding business operations to its most fundamental form and minimizes changes in business coding habits during the transition from a monolithic architecture to a microservice architecture.
The Cost and Path of Optimizing RPC Performance
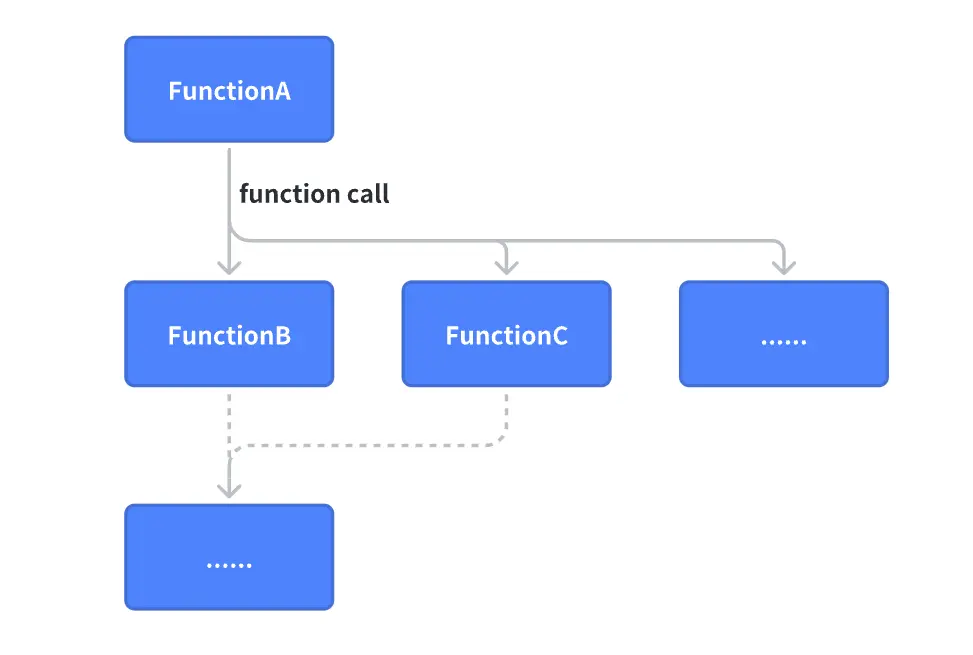
Before the introduction of RPC, the sole overhead in the following code is merely a function call, an operation at the nanosecond level, not accounting for inline optimization.
func client() (response) {
    response = server(request) // function call
}

func server(request) (response) {
    response.Message = request.Message
}
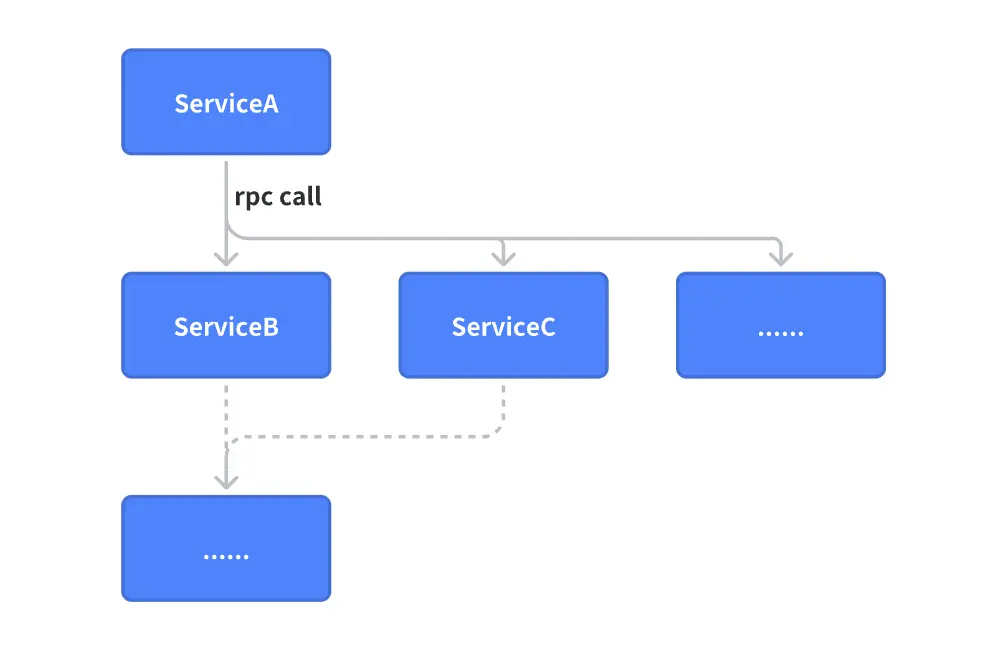
Upon transitioning to an RPC call, the overhead directly elevates to the millisecond level, a latency difference of 10^6, which highlights the high cost of RPC and indicates considerable room for optimization.
func client() (response) {
    response = client.RPCCall(request) // rpc call - network
}

func server(request) (response) {
    response.Message = request.Message
}
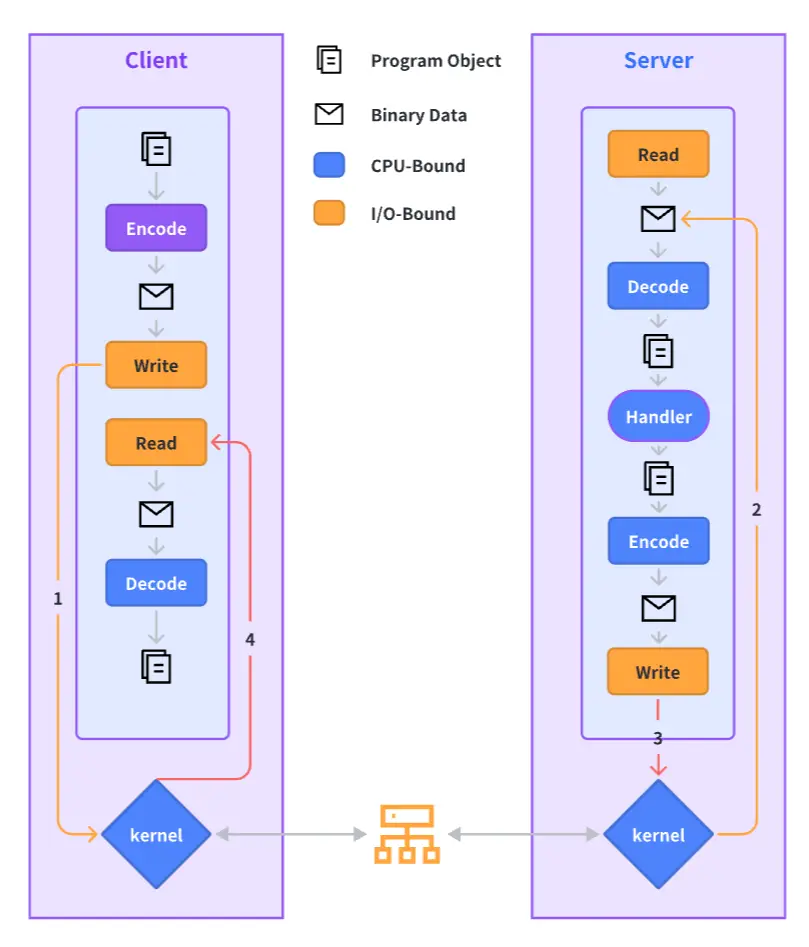
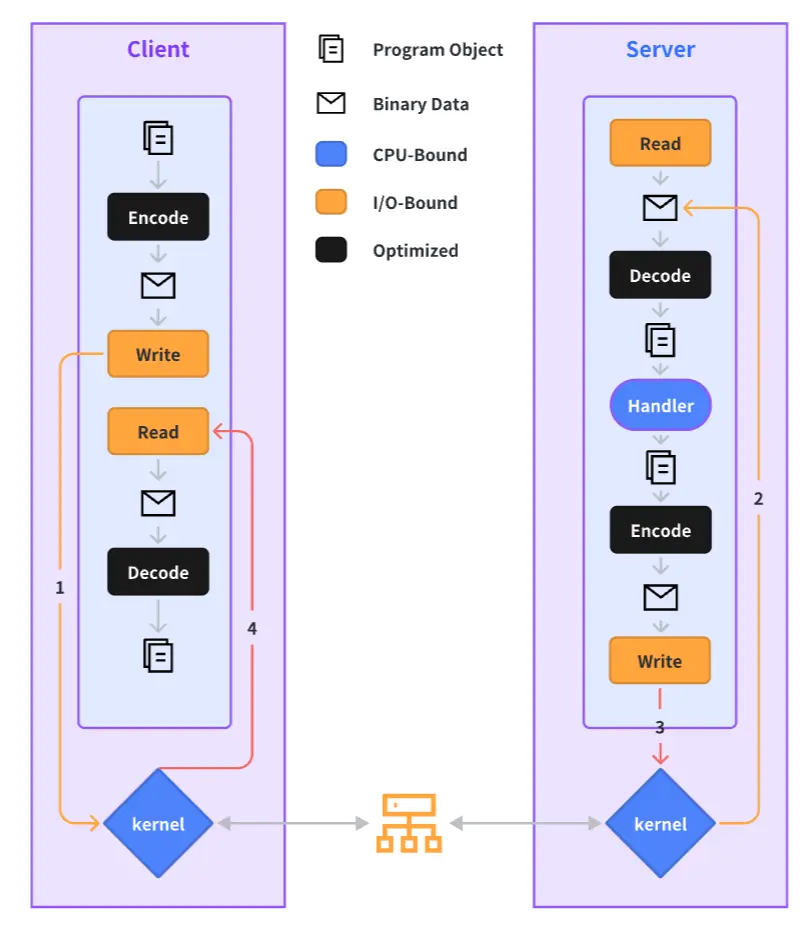
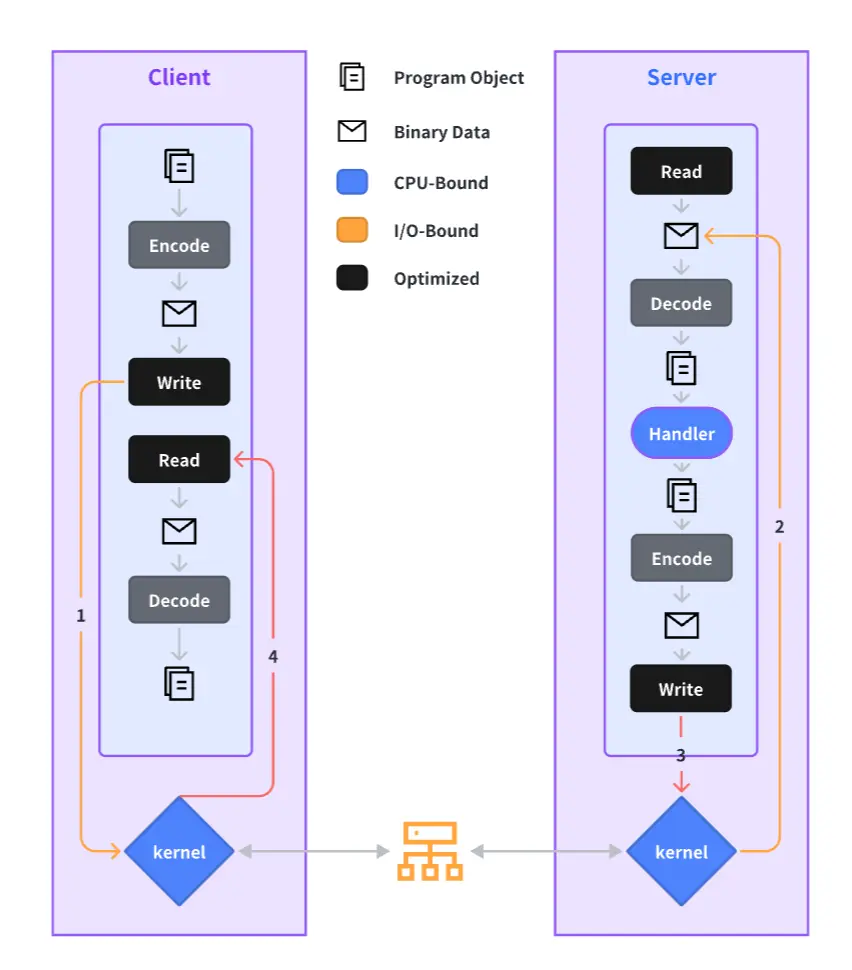
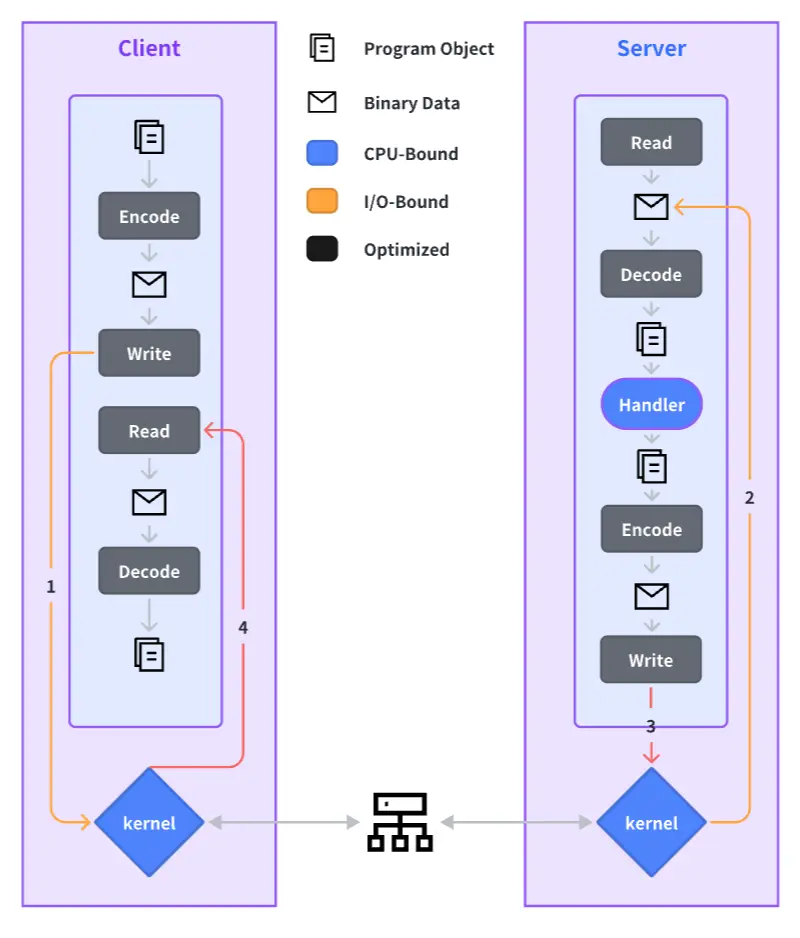
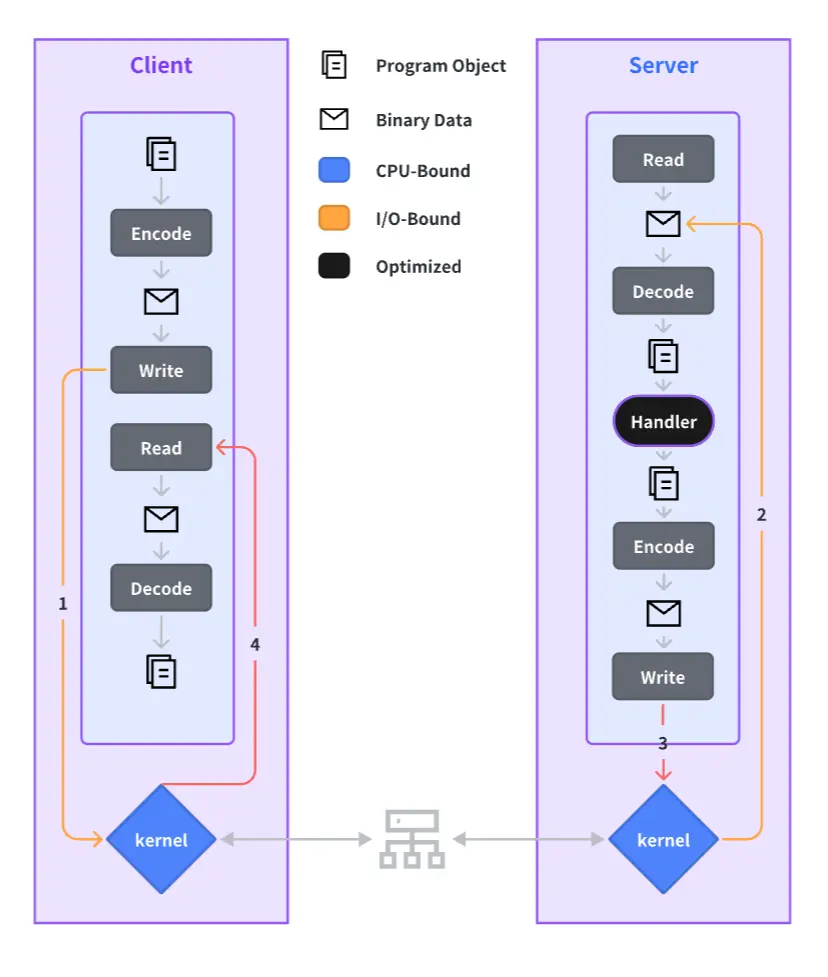
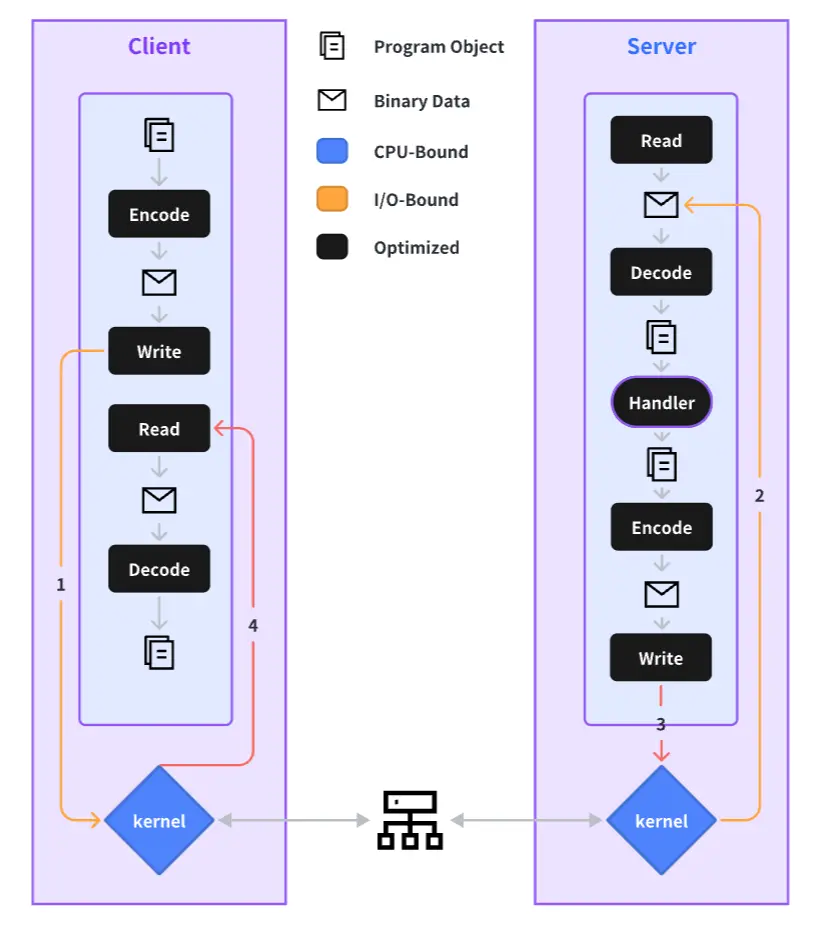
The complete process of an RPC call is outlined below, and we will elaborate on our performance optimization practices for each step in the sections to follow.
Why Develop Our Custom RPC Framework?
Before delving into performance practices, let’s talk about why we opted to develop a new RPC framework. There are numerous existing frameworks available, so why did we need a new one? Some of the primary reasons include:
Internally at our company, we primarily use the Thrift protocol for communication. Most mainstream Go frameworks do not support the Thrift protocol, and extending to support multiple protocols isn’t a straightforward task.
Recognizing our company’s extremely high performance requirements, we realized that deep optimization across the entire operation chain was essential. The vast scale and complexity of our microservices demanded a bespoke, highly customizable, and scalable framework that could provide such flexibility and meet our rigorous performance standards.
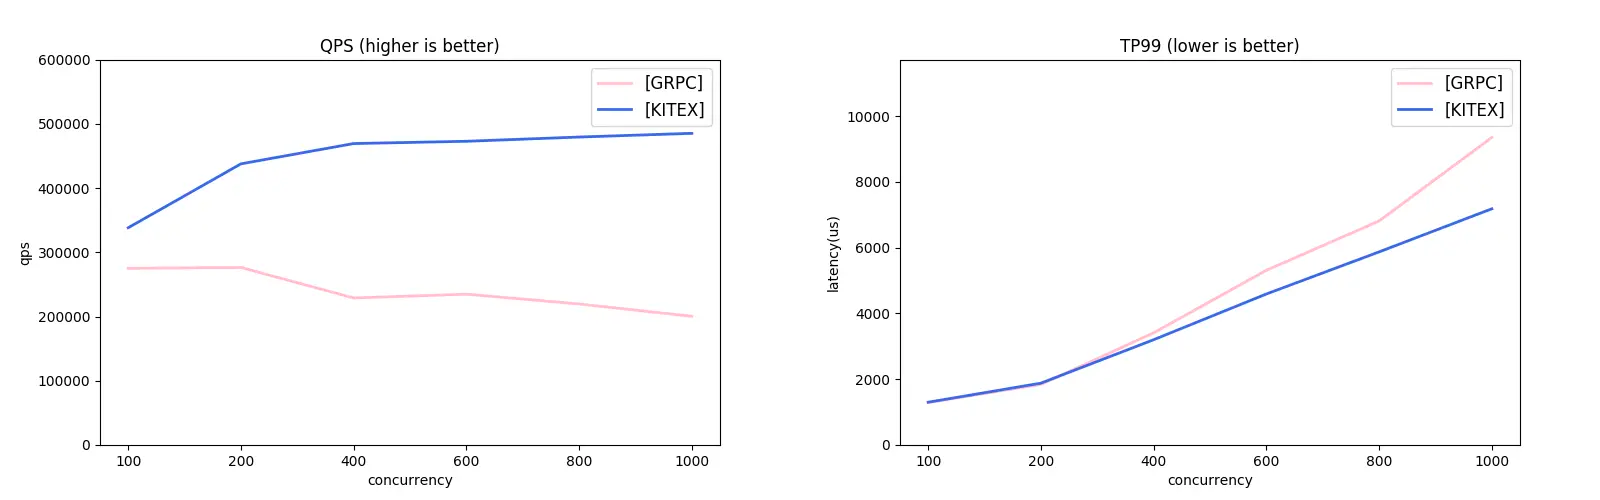
How Does Kitex Compare to Other Frameworks?
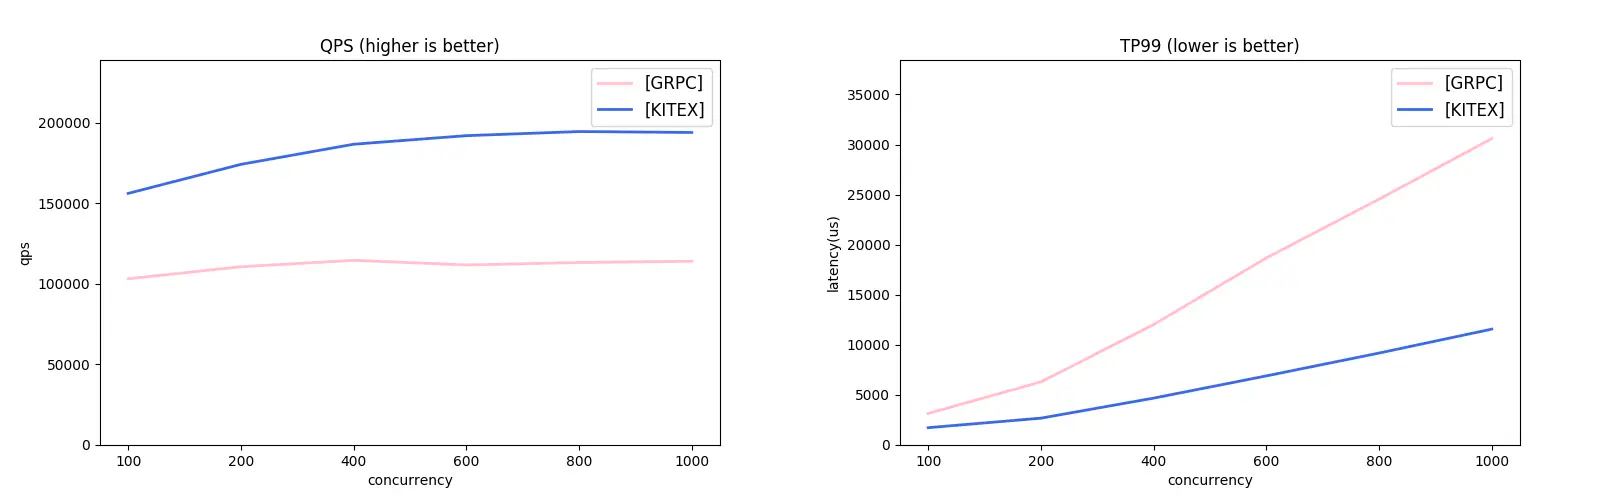
Kitex supports both the Thrift and gRPC protocols. Considering the lack of Thrift-compatible frameworks in the Go ecosystem, we used the gRPC protocol for our comparative study with the grpc-go framework. Check out the results:
gRPC Unary Comparison:
gRPC Streaming Comparison:
Performance Optimization Practices within the Kitex Framework
Many performance optimization strategies used in Kitex aren’t exclusive to Go; however, for the sake of convenience, we’re using Go in our examples. In the following sections, we’ll introduce different performance optimization practices applied in Kitex, following the process of a RPC call.
Optimizing Encoding and Decoding
Common Challenges with Encoding and Decoding
Using Protobuf as an example, we encounter the following problems associated with encoding decoding operations:
Computational Overhead:
a. Additional information needs to be retrieved through runtime reflection.
b. There’s a need to invoke multiple functions and create several small objects, which adds to the processing overhead.
Garbage Collection (GC) Overhead:
Memory reuse is a significant challenge, which often leads to the overhead of garbage collection operations during the encoding and decoding operations.
Code Generation Optimization: Introducing FastThrift & FastPB
We’ve introduced encoding and decoding capabilities to Kitex by generating a large volume of code for both Thrift and Protobuf protocols. Since generated code can optimize preset runtime information, we can avoid additional operations during runtime and achieve several benefits.
Memory Reuse and Size Pre-calculation
During serialization, we can invoke Size() at a minimal cost and use it to pre-allocate a fixed-size memory block.
Go code example:
type User struct {
   Id   int32
   Name string
}

func (x *User) Size() (n int) {
   n += x.sizeField1()
   n += x.sizeField2()
   return n
}

// Framework Process
size := msg.Size()
data = Malloc(size) // allocate memory
Encode(user, data) // encoding user object directly into the allocated memory to save one time of copy
Send(data) // send data
Free(data) // reuse the allocated memory at next Malloc
Minimize Function Calls and Object Creation
Reducing the costs of invoking functions and creating small objects can yield significant benefits. This approach is especially beneficial in a language like Go, which heavily utilizes garbage collection (GC).
As depicted below, the underlying fastWriteField function gets inlined during compile-time. As a result, the serialization FastWrite function essentially conducts sequential writing into a fixed piece of memory. A similar approach applies to FastRead.
Go code example:
func (x *User) FastWrite(buf []byte) (offset int) {
   offset += x.fastWriteField1(buf[offset:])
   offset += x.fastWriteField2(buf[offset:])
   return offset
}
// inline
func (x *User) fastWriteField1(buf []byte) (offset int) {
   offset += fastpb.WriteInt32(buf[offset:], 1, x.Id)
   return offset
}
// inline
func (x *User) fastWriteField2(buf []byte) (offset int) {
   offset += fastpb.WriteString(buf[offset:], 2, x.Name)
   return offset
}
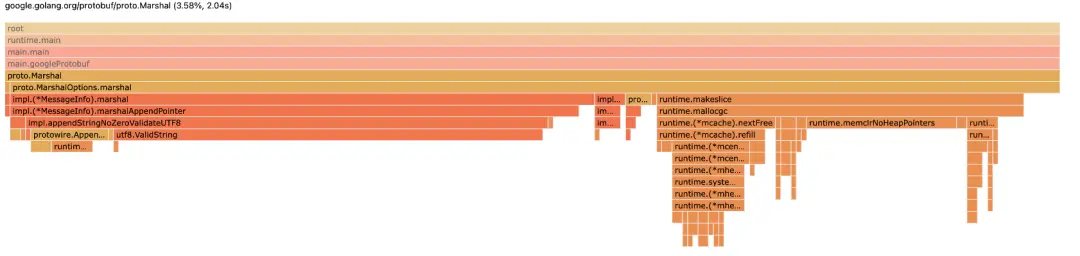
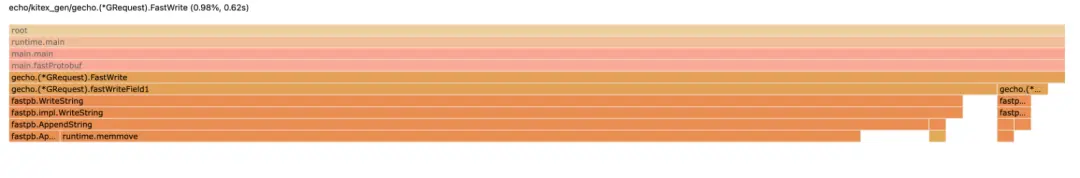
Optimization Results
As a result of these optimizations, we managed to improve the optimization output from the previous contribution of 3.58% to a notable 0.98%.
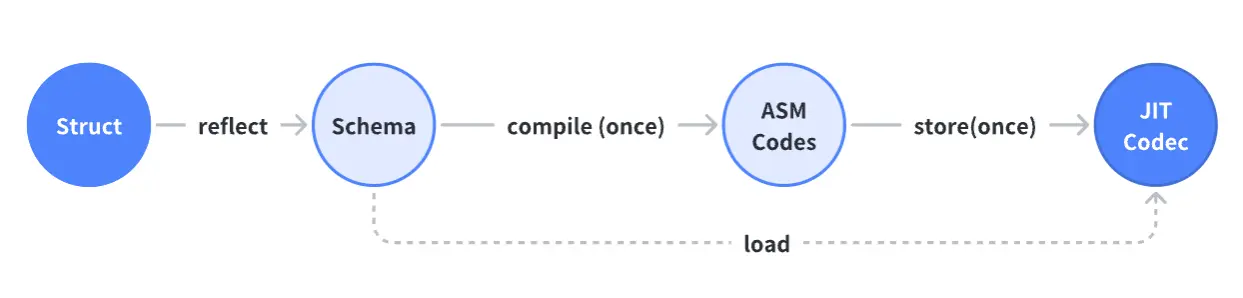
JIT Substitution for Code Generation: Introducing Frugal (Thrift)
After reaping gains from the hardcoded approach, we encountered the following feedback:
The volume of the generated code increases linearly with the growth of fields.
The generated code depends on the user’s version of their respective Kitex command-line tool, which can lead to conflicts during collaborations with multiple contributors.
The feedback encouraged us to consider if the previously generated code could be created automatically at runtime. The answer is ‘yes’ - but it would require the adoption of Just-In-Time Compilation (JIT) as a method of code optimization.
Advantages of JIT
Registers utilization and deeper inlining: this improves the efficiency of function calls.
Core computational functions use fully optimized assembly code, which leads to improved performance.
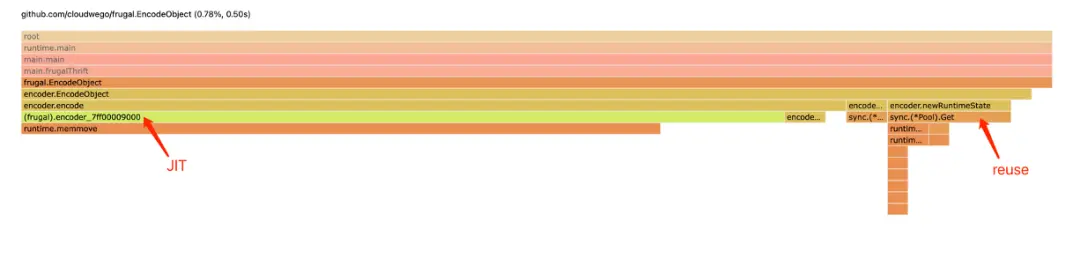
Optimization Results of JIT
As a result of JIT optimization, we improved the optimization result from 3.58% to an impressive 0.78%.
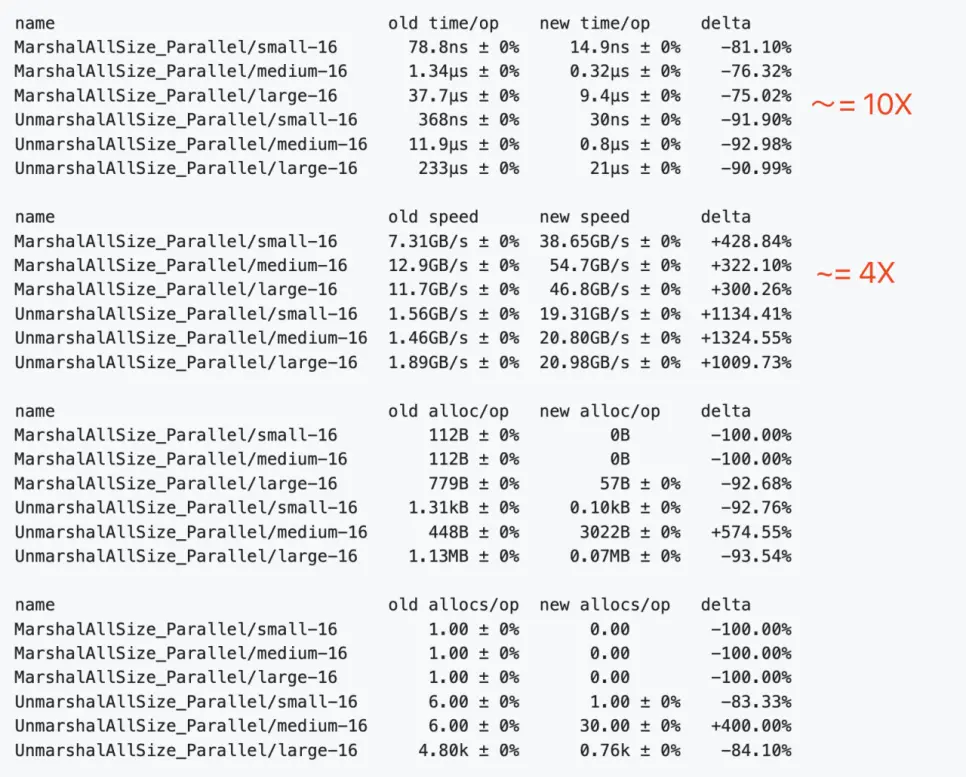
Comparing Frugal and Apache Thrift
This section presents a performance comparison of Frugal and Apache Thrift in the context of encoding and decoding.
Optimizing Network Library
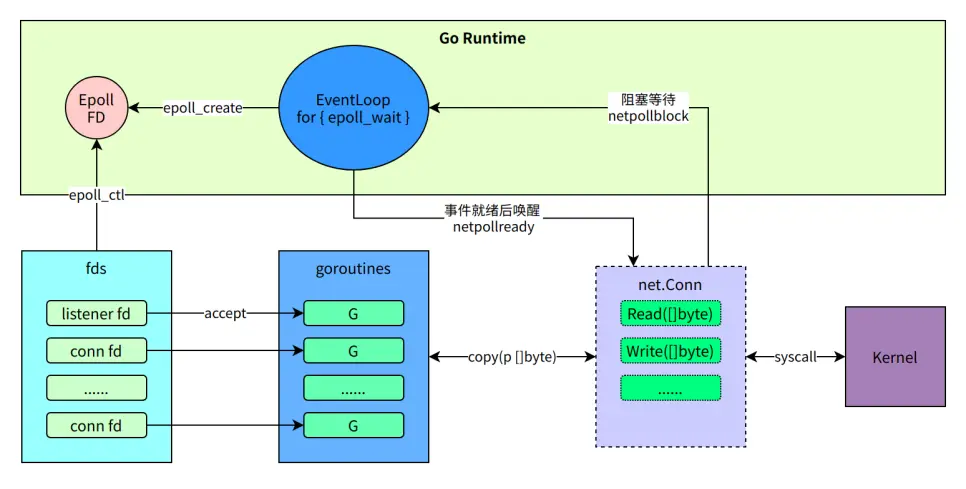
Native Go Net Challenges in RPC Scenarios
Native Go Net in RPC situations presents the following challenges:
Each connection corresponds to one coroutine - when there are numerous upstream and downstream instances, the sheer number of Goroutines can significantly influence performance. This is particularly detrimental for businesses with intensive instances.
It is unable to automatically detect the connection’s shutdown state.
When a struct undergoes NoCopy serialization, the output typically takes the form of a two-dimensional byte array. However, Go’s
Write([]byte)interface falls short as it does not support handling non-continuous memory data.Despite being highly compatible, it’s provided by Go Runtime and not conducive or suitable for adding new features.
Go Coding Example
name := "Steve Jobs" // 0xc000000020
req := &Request{Id: int32(1), Name: name}

// Encode to [][]byte
[
 [4 bytes],
 [10 bytes], // no-copy encoding, 0xc000000020
]

// Copy to []byte
buf := [4 bytes + 10 bytes] // new address

// Write([]byte)
net.Conn.Write(buf)
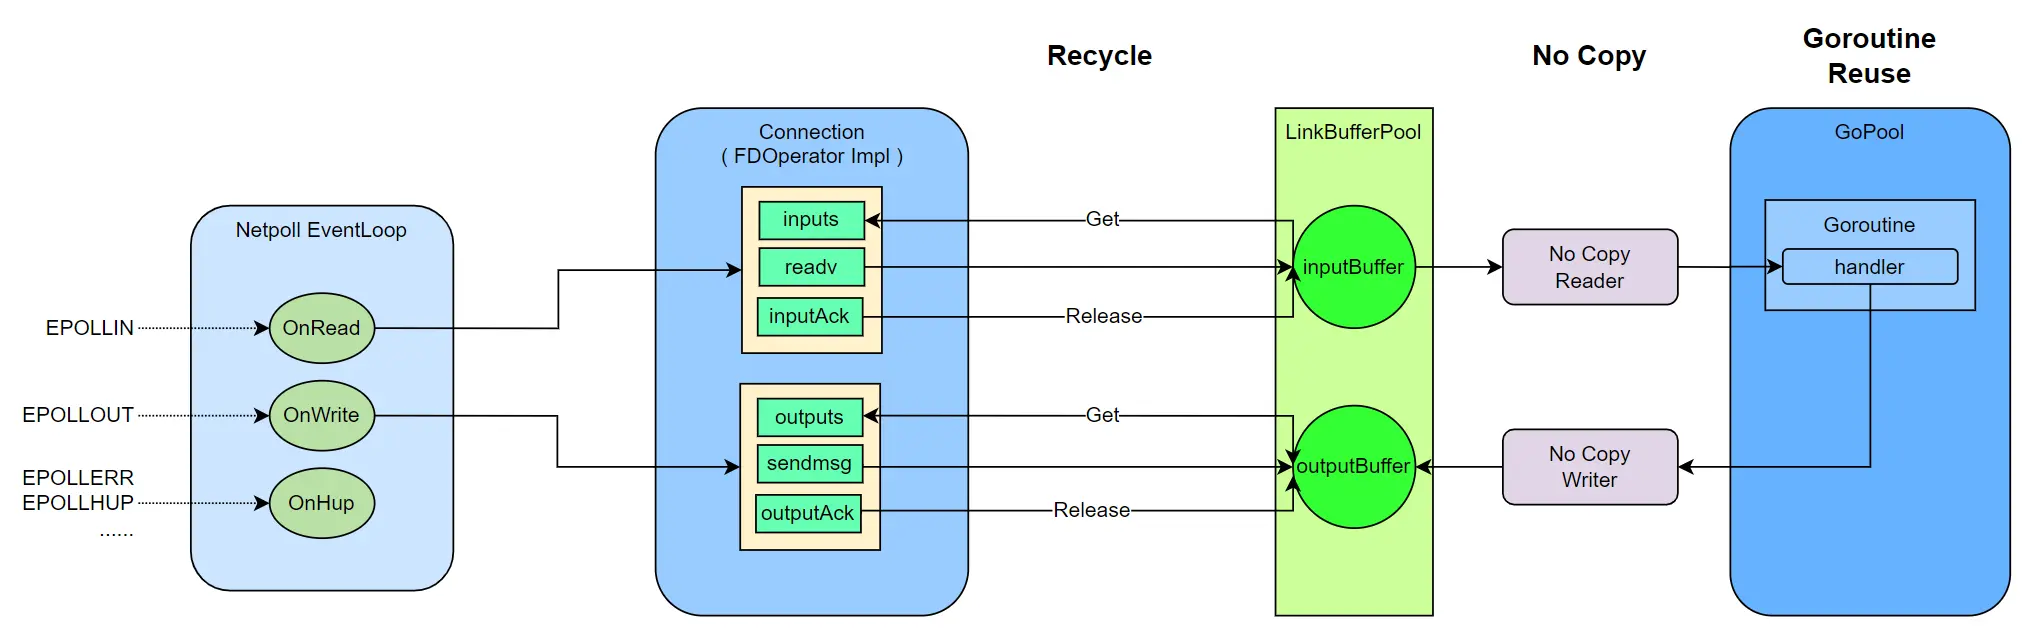
Netpoll Optimization Practices
Here are the main areas we focused on for optimization:
Coroutine Optimization: As much as possible, coroutines are reused and the number of connections aren’t tied to the number of coroutines.
Buffer Layer: Netpoll supports zero-copy read and write, and it reuses memory to minimize GC overhead during encoding and decoding.
Customization for RPC Small Packets High Concurrency Scenarios: Includes coroutine scheduling optimization, TCP parameter tuning, and more.
Deep Customization for Internal Environments: Includes modifying the Go Runtime to improve scheduling priority and kernel support for batch system calls, among other things.
Communication Layer Optimization
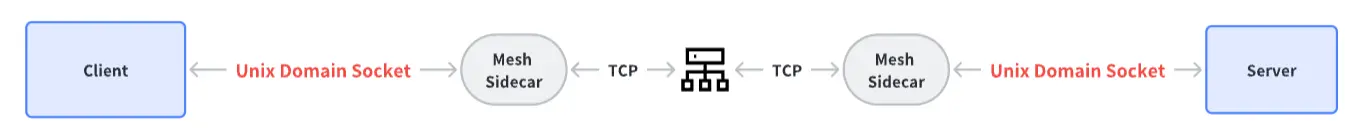
Intra-Machine Communication Optimization: Issues with Communication Efficiency under Service Mesh

After introducing Service Mesh, the business process primarily communicates with another sidecar process on the same machine, which brings in an additional layer of delay.
Traditional Service Mesh solutions commonly hijack iptables to facilitate traffic forwarding to the sidecar process. This could lead to substantial performance loss at all levels. Kitex has carried out several performance optimization attempts at the communication layer and has finally developed a systematic solution.
Optimization of Intra-machine Communication: UDS Replaces TCP
Performance Comparison between UDS and TCP:
======== IPC Benchmark - TCP ========
      Type    Conns     Size        Avg        P50        P99
    Client       10     4096      127μs       76μs      232μs
  Client-R       10     4096        2μs        1μs        1μs
  Client-W       10     4096        9μs        4μs        7μs
    Server       10     4096       24μs       13μs       18μs
  Server-R       10     4096        1μs        1μs        1μs
  Server-W       10     4096        7μs        4μs        7μs
======== IPC Benchmark - UDS ========
      Type    Conns     Size        Avg        P50        P99
    Client       10     4096      118μs       75μs      205μs
  Client-R       10     4096        3μs        2μs        3μs
  Client-W       10     4096        4μs        1μs        2μs
    Server       10     4096       24μs       11μs       16μs
  Server-R       10     4096        4μs        2μs        3μs
  Server-W       10     4096        3μs        1μs        2μs
Our performance test indicates the following:
UDS outperforms TCP in all measurements.
Nonetheless, the extent of improvement is not significant.
Optimization of Intra-Machine Communication: ShmIPC Replaces UDS
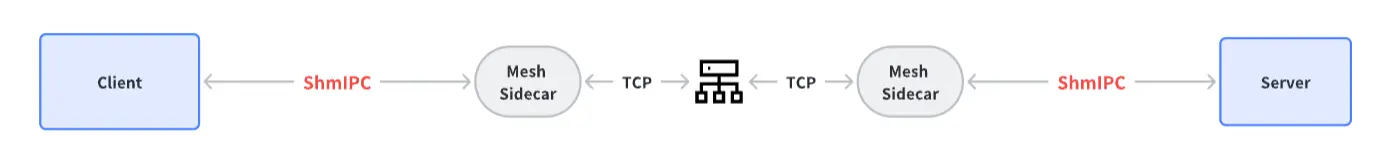
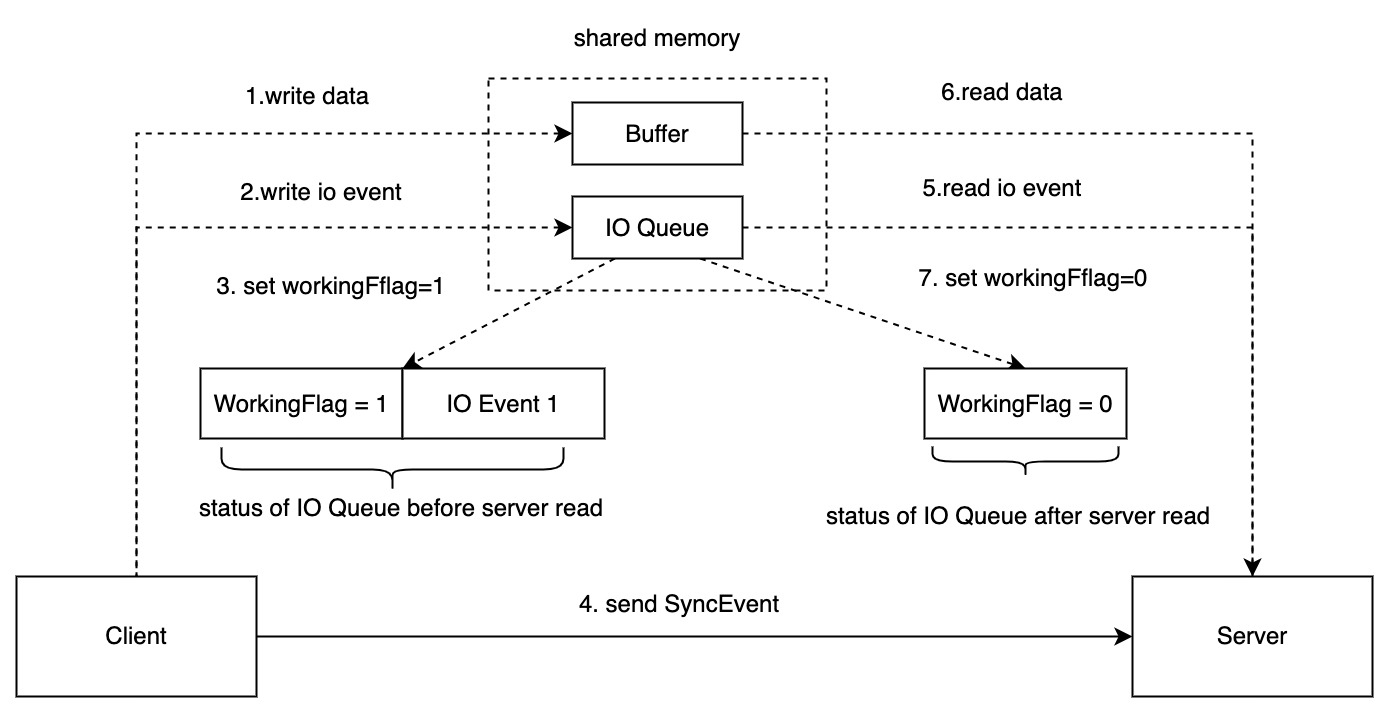
In pursuit of enhancing the efficiency of inter-process communication, we developed a communication mode based on shared memory. Shared memory communication throws in the complexity of managing the synchronization of various communication states across different processes.
To tackle this, we utilized our communication protocol and retained UDS as the event notification channel (IO Queue) and shared memory as the data transmission channel (Buffer).
For a detailed technical understanding of shmipc, you can refer to our previously published article: Introducing Shmipc: A High Performance Inter-process Communication Library.
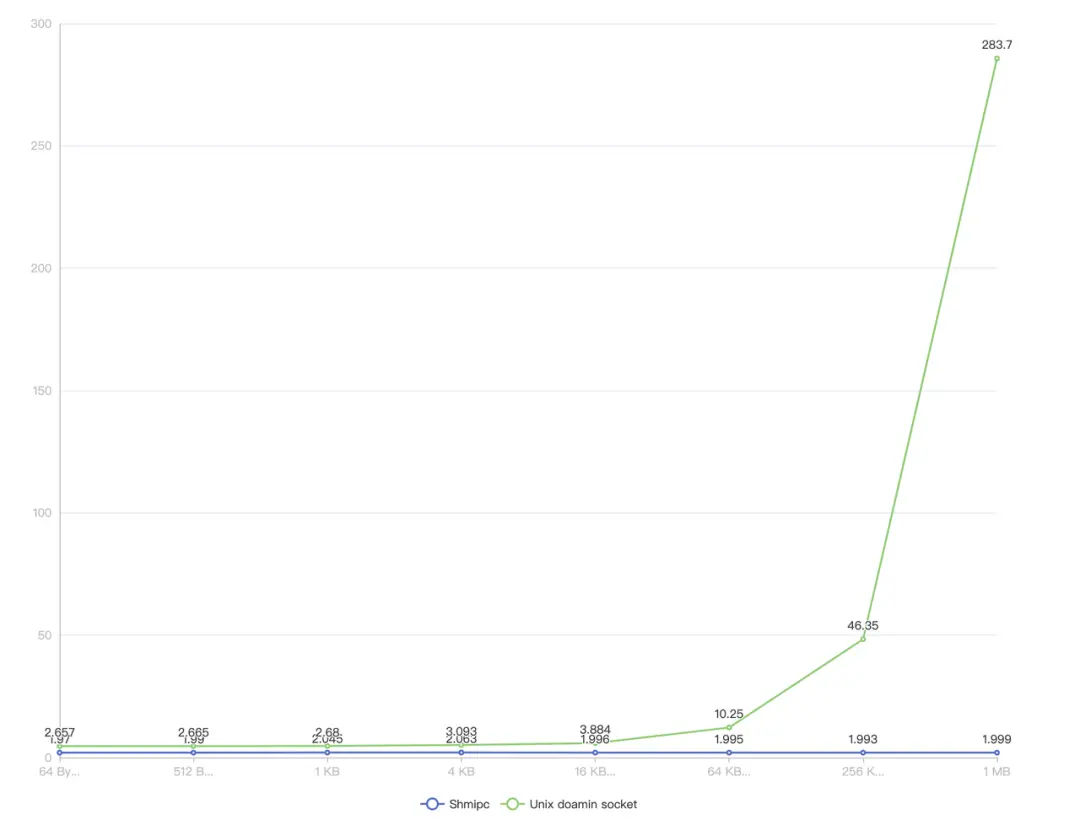
Performance Test:
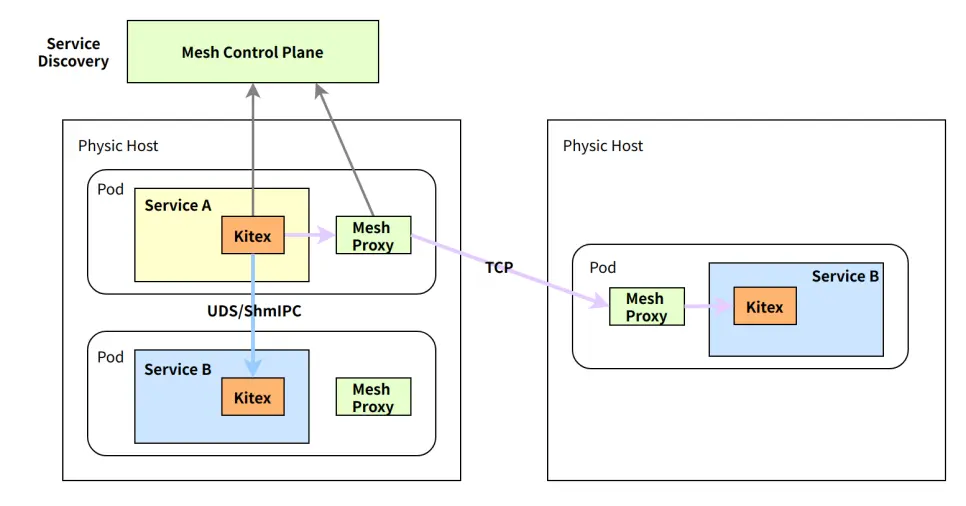
From Cross-Machine to Intra-Machine Communication: A Pod Affinity Solution
Having previously optimized intra-machine communication, we found that it’s limited to the data plane communication between the service process and the Service Mesh.
The peer service is possibly not hosted on the same machine. So, the question arises, how can we optimize cross-machine communication? One innovative approach we’re considering is converting cross-machine issues into intra-machine issues.
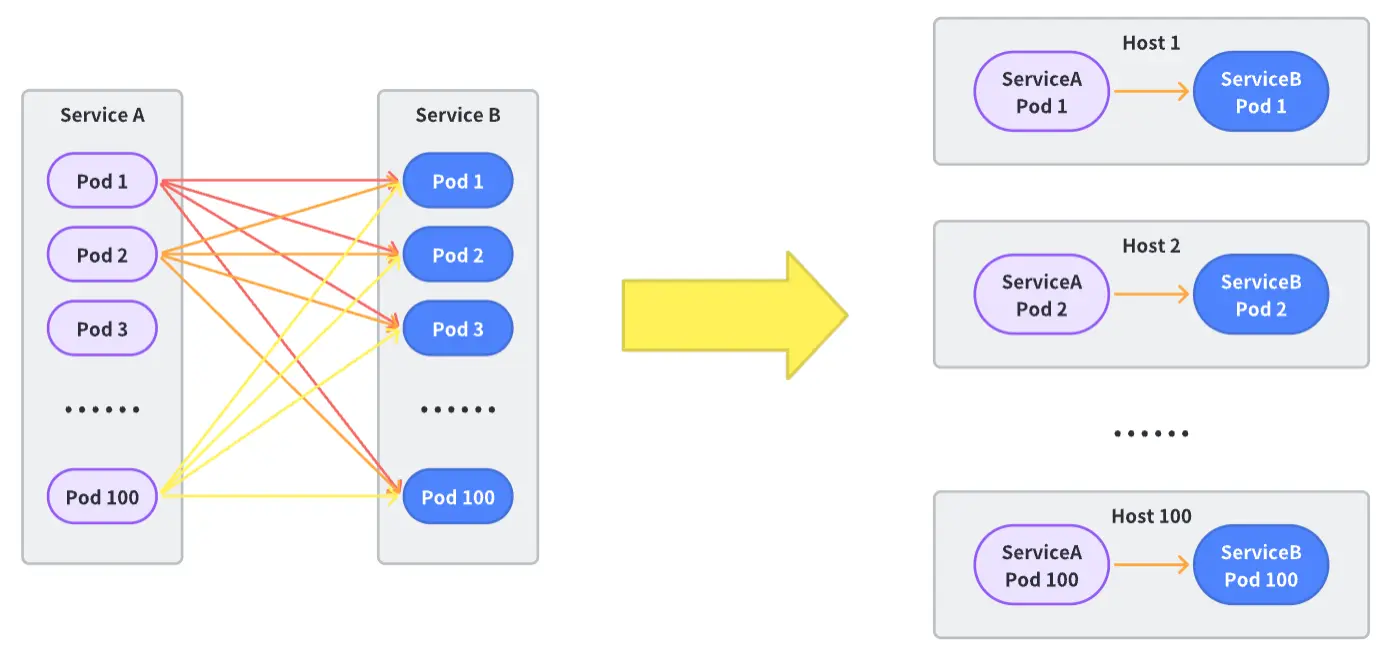
Achieving this in large-scale microservice communication calls for the cooperation of multiple architectural components. As such, we introduced the pod affinity solution to resolve this challenge:
Container Scheduling Layer Alteration: The container scheduling system will consider the relationship and instance situations of upstream and downstream services. It uses affinity scheduling to, as much as possible, assign the instances of upstream and downstream services to the same physical machine.
Traffic Scheduling Layer Alteration: The service control plane needs to identify which downstreams are connected to a certain upstream container. Bearing in mind the context of global load balancing, it calculates the dynamic weight of accessing downstream instances for each downstream instance, aiming to enable more traffic to facilitate intra-machine communication.
Framework Transformation: Extend custom support for the unique communication method of pod affinity. Based on the calculation results of the traffic scheduling layer, the request is dispatched to either the same machine instance or Mesh Proxy.
Microservice Online Tuning Practices
Apart from performance optimization at the framework level, the business logic itself is a significant contributor to the performance bottleneck. To combat this, we have accumulated several practical experiences and strategies.
Solving Latency Through Automated GC Optimization
Challenges with Go’s Native GC Strategy
Go’s Garbage Collection (GC) strategy was not specifically designed for microservice scenarios, and thus does not prioritize optimizing latency-sensitive businesses. However, RPC services often require low P99 latency.
The essential principles of Go’s GC strategy are as follows:
GOGC Principle:
The GOGC parameter sets a percentile value, defaulting to 100, to calculate the heap size required for the next GC trigger: NextGC = HeapSize + HeapSize * (GOGC / 100). This implies that under default settings, the heap size doubles after the last GC.
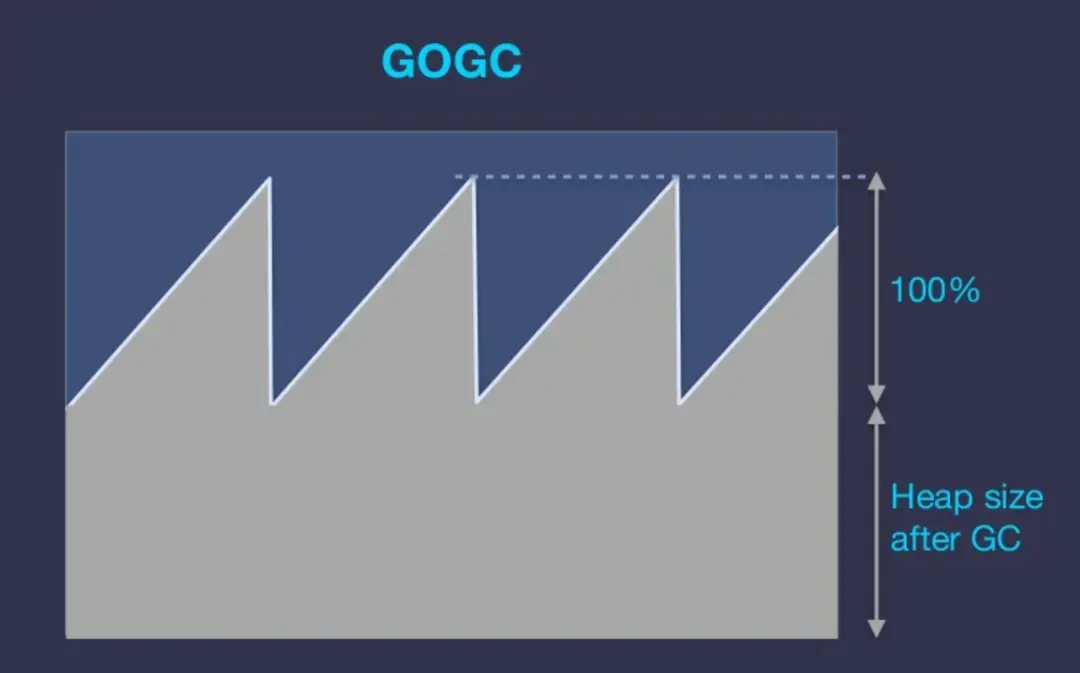
As an example, if a service’s active memory usage is 100MB, the GC is triggered every time the heap grows to 200MB, which may be unnecessary if this service has 4GB of memory.
Drawbacks:
In microservice environments, the service’s memory utilization rate is generally quite low, yet aggressive GC persists.
For RPC scenarios, a sizable number of objects are inherently highly reusable. Performing frequent GC on these reusable objects degrades the reusability rate.
Primary Requirement:
Decrease the frequency of GC and enhance the reuse rate of resources in microservices, while maintaining safe levels of memory consumption.
gctuner: Automated GC Optimization Strategy
Users can manipulate the desired aggressiveness of GC by setting a threshold, which could for example be set to memory_limit * 0.7. If the memory used is below this value, GCPercent is maximized as much as possible.
- If memory utilization doesn’t reach the set threshold, the GOGC parameter is set to a larger value, whereas if it exceeds the limit, it is set to a smaller value.
- Regardless of the situation, GOGC is capped at a minimum of 50 and a maximum of 500.
Advantages:
- GC is delayed when memory utilization is low.
- It reverts to the native GC strategy when memory utilization is high.
Cautions:
- If other processes share the memory resources, ensuring a reserve of memory resources for these different processes is crucial.
- Services in which memory is likely to have excessively extreme peak values might not find this strategy beneficial.
gctuner is currently open-sourced on GitHub.
Concurrent Optimization
What Is the Real CPU Utilization? - The Container Deception
apiVersion: v1
kind: Pod
spec:
  containers:
    - resources:
        limits:
          cpu: "4"
The rapid advancement of container technology has largely affected the development of microservices. Currently, the majority of microservices, including numerous databases across the industry, operate within container environments. For the purpose of this discussion, we’ll only touch upon mainstream containers based on cgroup technology.
A standard business development model involves developers acquiring a 4-core CPU container on the container platform. Developers usually assume that their program can utilize up to 4 CPUs simultaneously, and adjust their program configuration based on this understanding.
Upon deployment, if you check upon the container and verify with the ’top’ command, all indicators seemingly adhere to the 4-core standard:
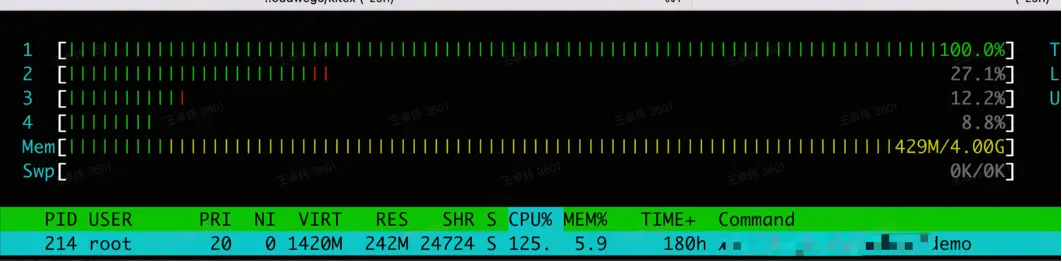
Even when using cat /proc/cpuinfo for inspection, you’ll witness exactly 4 CPUs.
processor        : 0
// ...
processor        : 1
// ...
processor        : 2
// ...
processor        : 3
// ...
However, these are merely illusions concocted by the container to ease your mental load off programming. The underlying reason for creating such an illusion is to ensure traditional Linux Debug tools function seamlessly within the container environment.
Contrarily, container technology based on cgroups imposes limits only on CPU time, not on the number of CPUs. Suppose you log into the machine to verify the CPU number each thread of the process is using. In that case, you might be taken aback to discover that the sum exceeds the CPU limit set for the container:

When a container requests 4 CPU units, it means it can run for an equivalent of 4 CPU time within a computation cycle (typically 100ms). It doesn’t imply that it can only use 4 physical CPUs, nor that at least 4 CPUs can be simultaneously utilized by the program. If the usage time surpasses the CPU limit set for the container, all processes within the container are paused until the end of the computation period. This could lead to the program experiencing lagging issues (throttled).
Is Faster Downstream Parallel Processing Always Better? - Concurrency vs. Timeout
Knowing the upper bound for physical parallel computing in a program is considerably high, we can leverage this insight to increase or decrease the number of working threads (GOMAXPROCS) or adjust the degree of concurrency within the program.
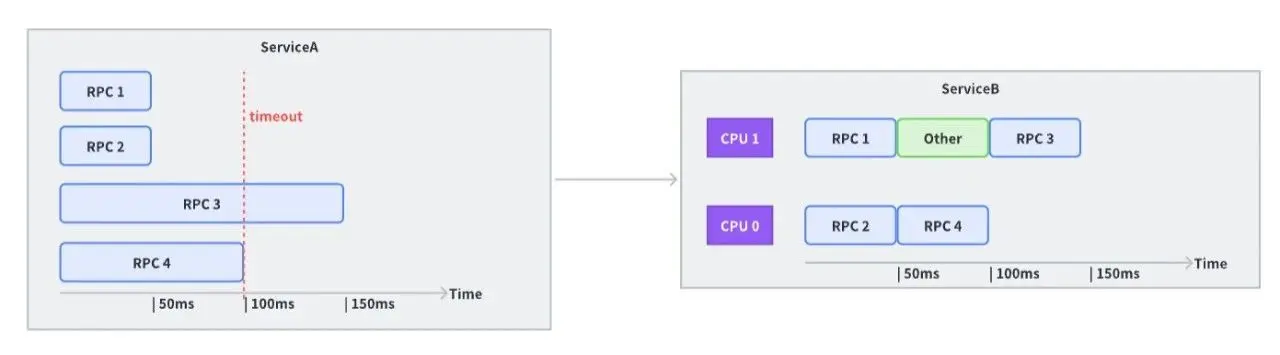
Let’s consider a calling scenario where the business sends requests to the same upstream with four concurrent processes. Each request upstream requires 50ms of processing time. Based on this, the downstream sets the timeout time to 100ms.
Though this seems reasonable, if, at that time, the upstream had only two CPUs available to handle requests (which also have to manage other work or perform Garbage Collection activities), the third RPC request would likely time out.
However, simply reducing concurrency isn’t always the solution and it doesn’t benefit all cases.
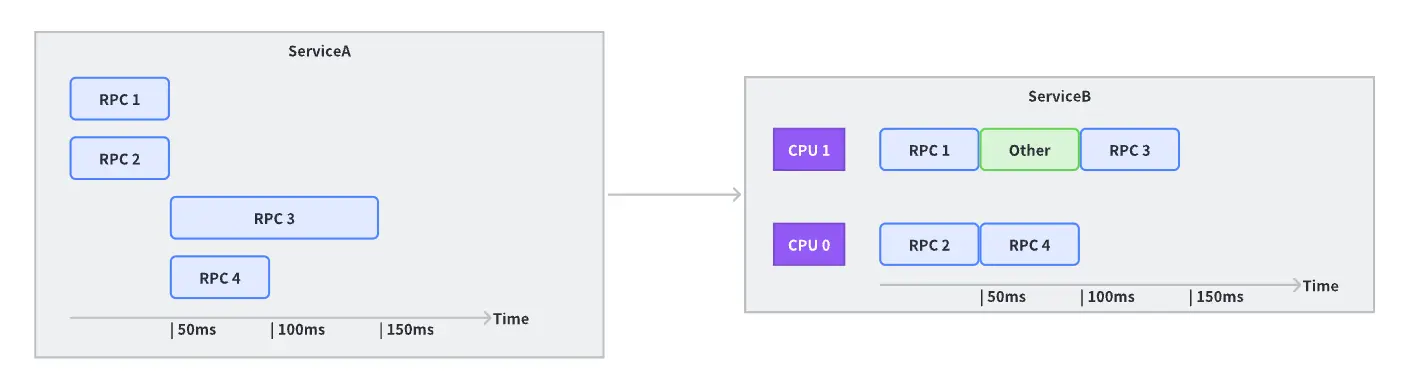
If upstream’s computational resources are abundantly available, increasing concurrency could efficiently utilize the processing power upstream.
Balancing Resource Utilization – Reserving Computational Capacity for Other Processes
If there are multiple processes within the container, it’s essential to reserve resources for these operations. This consideration is particularly crucial in scenarios like the deployment of a Service Mesh data plane, where the same container operates as a sidecar.
If a downstream process utilizes the entirety of the time slice allocated within a computation cycle, it’s highly probable that it’ll face resource throttling when it’s the upstream process’s turn, which could subsequently affect the service’s latency.
Optimizing Service Concurrency Degree
Adjust the Number of Work Threads: For instance, the
GOMAXPROCSdirective in Go allows us to modify the number of working threads.Alter the Concurrency of Requests in the Code: It’s essential for businesses to iteratively test and evaluate the trade-off between the latency gains from increasing concurrency and the stability loss at peak levels to determine an optimal concurrency value.
Use Batch Interfaces: If the business scenario allows, replacing the current interface with a batch interface could be a more effective strategy.
Looking into the Future of Optimization
The Final Frontier: Kernel
Currently the only area we haven’t explored for optimization is the Kernel.
In online business environments, we often observe that the communication overhead of RPC accounts for more than 20% of the total overhead for services heavy on I/O operations, even after optimizing RPC to the level of intra-machine communication.
At this point, we’ve optimized inter-process communication to its extremes. If we are to seek further improvements, we need to break through the existing constraints in Linux inter-process communication fundamentally.
We’ve already made some preliminary strides in this area. We will continue to share updates on this topic in future articles, so stay tuned.
Reassessing the TCP Protocol
In the context of internal data center communication, the TCP protocol displays some limitations:
Given the superior internal network quality and an incredibly low packet loss rate, many designs within TCP appear redundant.
In situations of large-scale point-to-point communication, TCP long connections may inadvertently degrade into short connections.
While the application layer uses “messages” as a unit, TCP data streams don’t offer clear message boundaries, which could complicate synchronization and message handling.
This has led us to question whether we need to develop a proprietary data center protocol, better suited to handle RPC communication.
Continuing to Refine Existing Components
When it comes to existing components, we plan to continue our efforts to enhance their performance and applicability:
Frugal, the Thrift JIT Encoder/Decoder:
Introducing support for the ARM architecture.
Optimizing the backend with Static Single Assignment (SSA).
Accelerating performance with Single Instruction, Multiple Data (SIMD) operations.
Netpoll Network Library:
Refactoring interfaces to ensure seamless integration with existing libraries in the Go ecosystem.
Implementing support for Shared Memory Communications over RDMA (SMC-R).
Pod Affinity:
- Expanding from same-machine to same-rack granularity, effectively reducing network latency and improving performance.
In this post, we explored optimizing microservices performance using Kitex, the RPC framework developed by ByteDance. We discussed various techniques, from encoding and decoding enhancements, JIT compilation, network library optimization, and communication layer upgrades, to automated GC optimization, concurrent processing strategies, and microservices online tuning practices.
Kitex has demonstrated its ability to outperform other frameworks in testing comparisons, showcasing its strength in handling complex microservice architectures.
We also briefly looked towards future optimizations, including kernel-level improvements, restructuring the TCP protocols, and further refinement of existing components. With continuous learning and improvements, we are driven to unlock the vast potential in microservice performance optimization, taking us one step closer to the realm of real-time computing.
For any questions or discussions, you’re welcome to join our community on GitHub or Discord.