Panic Self-check Guide
How to read an error stack
When encountering any panic, please follow the following 4-step approach to troubleshoot:
- Identify the cause of the panic.
- Determine where to start reading the stack.
- Identify the method that triggered the error.
- Locate the specific code location of the error.
The diagram below illustrates a typical panic error stack and indicates the positions of the four main pieces of information.
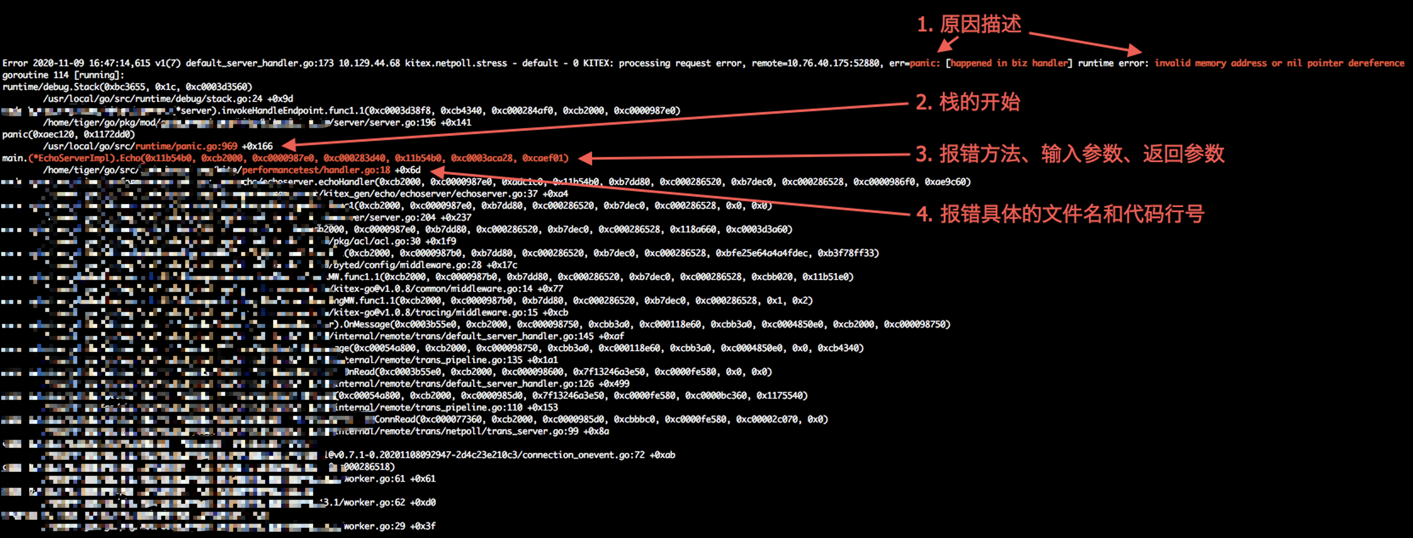
Cause of the Panic
Before the error stack begins with goroutine \d [running]:, there will be a description that follows either of these formats:
panic: xxx...
// or
fatal error: xxx...
This description indicates the specific cause of the panic and is the first piece of information to understand.
Common error causes include the following:
panic: runtime error: invalid memory address or nil pointer dereference
Error Cause: Code encountered a nil pointer exception.
panic: runtime error: index out of range [1] with length 1
Error Cause: Array access out of bounds. For example, trying to access index 1 of an array with a length of 1 (only index 0 exists).
panic: runtime error: slice bounds out of range [2:1]
Error Cause: Attempting to slice an array with invalid parameters. For example,
p = p[2:1]where the slice indices are incorrect.fatal error: concurrent map writes
fatal error: concurrent map read and map write
Error Cause: Both of these errors are caused by concurrent operations on a
map, either concurrent writes or concurrent read and write.It is important to note that concurrent operations on a
mapwill cause the program to crash. This type of crash cannot be recovered usingrecover. The error typically starts withfatal error:. Users who are unfamiliar with this can refer to the following explanation: Linkpanic: [happened in biz handler] ……
Error Cause: Descriptions starting with
[happened in biz handler]indicate panics captured by the x framework, but the panic is caused by business logic. Therefore, it is definitely a problem with the business code. The specific error cause should be examined after the[happened in biz handler]part.For example, the following error indicates an attempt to use an
interface{}parameter as astring, but theinterface{}parameter itself isnil:Go panic: [happened in biz handler] interface conversion: interface {} is nil, not stringpanic: ……
Error Cause: Some panics may be printed by the business code itself using
panic("xxx"). In this case, thepanic:will be followed by the custom printed content. By searching for this content, you can find the location of thepanicand further investigate the error cause.
Starting Position of the Stack
Once you have identified the cause of the panic, the next step is to locate the position in the code where the error occurred. To do this, you need to understand how to read the error stack and where to start.
The error stack typically begins with the following line, which indicates that a panic has occurred and has been recovered:
/.../go/src/runtime/panic.go:\d +0x\d
If this line is not present, it means that the panic was not recovered and you should start reading the stack from the beginning.
Specific Method that Triggered the Error
After identifying the starting position of the error stack, the next line will indicate the specific method that triggered the panic.
Referring to the example diagram, the line would look like this:
main.(*EchoServerImpl).Echo(0x11b54b0, 0xcb2000, 0xc0000987e0, 0xc000283d40, 0x11b54b0, 0xc0003aca28, 0xcaef01)
This line tells us that the panic occurred while executing the method Echo defined in the EchoServerImpl struct. The values enclosed in parentheses describe the specific parameters and return values of the method.
Specific File Location of the Error
The panic error stack typically follows a pattern where every two lines represent a call hierarchy. The first line describes the calling method, and the second line indicates the file location where the call occurred. Here’s an example stack trace:
main.(*EchoServerImpl).Echo(0x11b54b0, 0xcb2000, 0xc0000987e0, 0xc000283d40, 0x11b54b0, 0xc0003aca28, 0xcaef01)
        /home/tiger/go/src/xxx/performancetest/handler.go:18 +0x6d
xxx/performancetest/x_gen/echo/echoserver.echoHandler(0xcb2000, 0xc0000987e0, 0xadc1c0, 0x11b54b0, 0xb7dd80, 0xc000286520, 0xb7dec0, 0xc000286528, 0xc0000986f0, 0xae9c60)
  /home/tiger/go/src/xxx/performancetest/x_gen/echo/echoserver/echoserver.go:37 +0xa4
- The first line indicates that the method being called is
*EchoServerImpl.Echo. - The second line indicates that the panic occurred in line 18 of the file
/.../handler.go. - The third line indicates that the
*EchoServerImpl.Echomethod is called by theechoHandlermethod (which is the calling parent ofEcho). - The fourth line indicates that the
echoHandlermethod calls theEchomethod from line 37 of the fileechoserver.go. - And so on…
Once you have the specific file location of the error, you can locate the corresponding code and investigate the issue based on the cause of the panic.
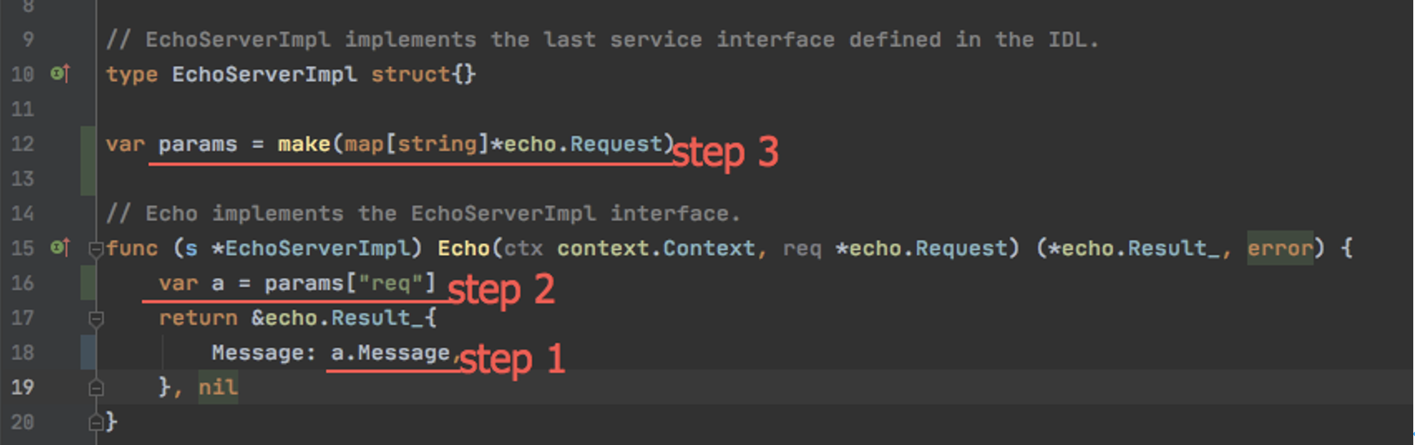
In the example diagram, we have determined that the error occurred at line 18 in handler.go, and the cause of the error is a nil pointer in the a.Message expression. This indicates that a might be nil because there is no nil check on params. By modifying the code accordingly, we can fix the bug.
Nil Pointer
“I know there is a nil pointer in this line of code, but I don’t know which parameter is causing it.”
The above statement is a key question when troubleshooting nil pointers. In this advanced section, we will explain how to identify which parameter is causing the nil pointer.
Based on the troubleshooting methods, we can classify nil pointer situations into two categories:
- One type is when a nil pointer is passed as a parameter. These nil pointer issues can be directly identified through the error stack.
- Another type is when a local parameter becomes a nil pointer. These nil pointers cannot be directly located using the error stack, but they can be identified by examining the code.
Identifying through the Error Stack
The error stack provides information about the specific method, including the request parameters and return values. Here is an example line from the error stack:
main.(*EchoServerImpl).Echo(0x11b54b0, 0xcb2000, 0xc0000987e0, 0xc000283d40, 0x11b54b0, 0xc0003aca28, 0xcaef01)
In this example, the values 0x... represent the characteristics of the parameters. By observing whether these values are 0x0, we can quickly determine if a specific parameter is nil.
Let’s briefly explain the output rules and their meanings for these 0x... values:
- The
0x...values appear in the order of the method itself, input parameters, and return values.
func (s *EchoServerImpl) Echo(ctx context.Context, req *echo.Request) (*echo.Result_, error)
For example, if the Echo method encounters an error, the order of the 0x... values would be: (s *EchoServerImpl)(0x11b54b0), ctx(0xcb2000, 0xc0000987e0), req(0xc000283d40), *echo.Result_(0x11b54b0), error(0xc0003aca28, 0xcaef01)
- The length of the
0x...values depends on the system’s word length. On a 64-bit system, each0x...value occupies 64 bits, and a maximum of 10 word lengths can be printed in the stack. - The relationship between each parameter and its corresponding
0x...value is described in the following table:
| Type | Description |
|---|---|
| Global method (func) | Occupies 0 word length, meaning it will not be printed |
(*struct) func | Occupies 1 word length, meaning it occupies a single 0x... |
| Pointer type | Occupies 1 word length, meaning it occupies a single 0x... |
int | Occupies 1 word length and represents the value of the int. For example, if var a int = 1, it would be represented as 0x1 |
Interface (interface{}) type | Occupies 2 word lengths, meaning 0x.., 0x.. respectively represent 1. the pointer to the actual type and 2. the data pointer |
string | Occupies 2 word lengths, meaning 0x.., 0x.. respectively represent 1. the pointer to the underlying array and 2. the length of the string. For example, if string("hello"), it would be represented as 0x.., 0x5 |
slice [] | Occupies 3 word lengths, meaning 0x., 0x., 0x. respectively represent 1. the pointer to the underlying array, 2. the length (len), and 3. the capacity (cap). For example, if var p = make([]byte, 2, 4), it would be represented as 0x., 0x2, 0x4 |
bool, byte, int16, int32, etc. | Occupies the same word length as themselves and has a value equal to themselves. If these parameters appear consecutively, they will be combined into a single word length. For example, func(a, b int32); a, b = 1, 2 would be represented as 0xc000020001 on a 64-bit system |
Using the above knowledge, we can quickly determine if a specific pointer is nil by checking if the corresponding pointer parameter in the stack is 0x0.
Note: The “interface type” mentioned above, if the first word length is nonzero andthe second word length is 0x0, indicates a “typed nil pointer”.
“A typed nil pointer” is not equal to nil and cannot be captured using if $ == nil {...}. This is a common issue for beginners. Please refer to relevant resources for more information.
Troubleshooting Example
In the following error stack, we quickly notice that
*Deviceis0x0, indicating that*Deviceis a nil pointer. By examining the call stack further, we can see that*Deviceis called by*Log.writeField5.Since this is generated code, we can conclude that the fifth field
*Deviceof the generated*Logstructure is not assigned a value, resulting in a nil pointer. To determine where exactly the assignment is missing, we can trace the stack downwards. Further details are not discussed here.: panic in processor: runtime error: invalid memory address or nil pointer dereference goroutine 498022546 [running]: .../xxx/x.(*RpcServer).processRequests.func1(0xc000424550) /.../xxx/x/kitex_server.go:227 +0xc8 panic(0x2b97ca0, 0x5b05400) /usr/local/go/src/runtime/panic.go:522 +0x1b5 .../thrift_gen/.../log.(*Device).writeField1(0x0, 0x36ce900, 0xc008478e00, 0x0, 0x0) /.../thrift_gen/.../log/ttypes.go:576 +0x18f .../thrift_gen/.../log.(*Device).Write(0x0, 0x36ce900, 0xc008478e00, 0x5000c, 0x0) /.../thrift_gen/.../log/ttypes.go:539 +0x197 .../thrift_gen/.../log.(*Log).writeField5(0xc0060216c0, 0x36ce900, 0xc008478e00, 0x0, 0x0) /.../thrift_gen/.../log/ttypes.go:1254 +0x1a7 ...In the following error stack:
KITE: processing request error=KE.UNREGISTERED/0 - ?/0: KITC: panic, runtime error: invalid memory address or nil pointer dereference
goroutine 271 [running]:
.../xxx/kitex.RPCTimeoutMW.func1.1.1(0x2dad3a0, 0xc0009c3260, 0xc000db81a0, 0x0, 0x0, 0xc0009c32c0)
/.../xxx/kitex/middlewares.go:314 +0xcc
panic(0x274e520, 0x4568230)
/usr/local/go/src/runtime/panic.go:522 +0x1b5
.../xxx/kitex.IOErrorHandlerMW.func1(0x2dad3a0, 0xc0009c3260, 0x0, 0x0, 0x0, 0x0, 0x0, 0x0)
/.../xxx/kitex/middlewares.go:260 +0x13e
.../xxx/kitex.NewPoolMW.func1.1(0x2dad3a0, 0xc0009c3260, 0x0, 0x0, 0x1, 0xc0007fe5ed, 0x4, 0xc0007fe640)
/.../xxx/kitex/middlewares.go:430 +0x41a
.../xxx/kitex.NewInstanceBreakerMW.func3.1(0x2dad3a0, 0xc0009c3260, 0x0, 0x0, 0xc000087a40, 0xc0000bb350, 0x27, 0xc00049d950)
/.../xxx/kitex/middlewares.go:522 +0x168
.../xxx/kitex.NewLoadbalanceMW.func2.1(0x2dad3a0, 0xc0009c3260, 0x0, 0x0, 0x2, 0x29b9e8e, 0x7, 0x0)
/.../xxx/kitex/middlewares.go:707 +0x389
.../xxx/kitex.NewServiceDiscoverMW.func1.1(0x2dad3a0, 0xc0009c3260, 0x0, 0x0, 0xc000978024, 0x2, 0xc0009de750, 0xc0009ee758)
/.../xxx/kitex/discoverer.go:237 +0x1a7
.../xxx/kitex.NewIDCSelectorMW.func1.1(0x2dad3a0, 0xc0009c3260, 0x0, 0x0, 0xc000db81a0, 0x0, 0x0, 0xc0009c32c0)
/.../xxx/kitex/middlewares.go:218 +0xfe
.../xxx/kitex.RPCTimeoutMW.func1.1(0x2dad3a0, 0xc0009c3260, 0xc000db81a0, 0x0, 0x0, 0xc0009c32c0, 0xc0005352b0, 0xc000535530, 0xc000535540)
/.../xxx/kitex/middlewares.go:324 +0xb1
created by .../xxx/kitex.RPCTimeoutMW.func1
/.../xxx/kitex/middlewares.go:309 +0x1d9
, remote=10.14.55.44:62592
First, we locate …/runtime/panic.go and start examining the error stack from there.
As we scroll down, we quickly notice a series of
0x0, and it appears that these0x0values are propagated along the way (as highlighted in red). Therefore, we initially suspect that nil pointer arguments might be passed.Next, based on the aforementioned information, we find the code location and briefly review the code. As shown in the diagram below, the method at line 260 has four
interface{}parameters and return values, corresponding to eight0x...values. We examine the seventh line of the error stack, which indeed contains eight values. Among them, the third and fourth0x...values correspond torequest interface{}. Hence, we tentatively conclude that the argumentrequestisnil.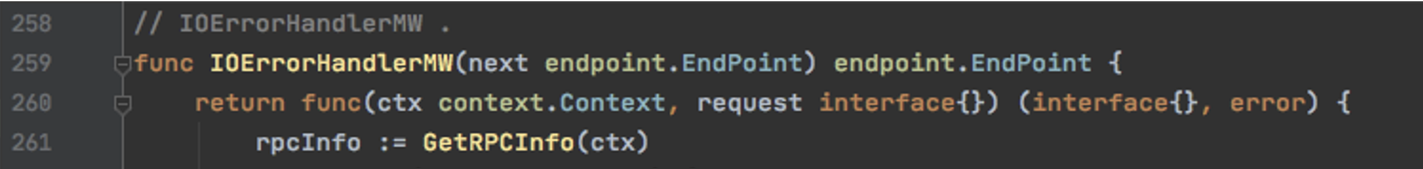
Continuing to inspect the stack, we find the caller of
IOErrorHandlerMW, with corresponding0x0values. Again, both0x0values correspond torequest, indicating that therequestparameter of the request is passed asnil.
Checking the Code for nil Pointers
If the previous method of investigation did not identify any 0x0 parameters, it means that the nil pointer is not in the passed parameters.
In such cases, we can use the process of elimination to narrow down the code causing the error. By excluding the parameters used in the line of code triggering the error, we can focus on the remaining parameters, where the panic likely originates.
For example:
KITEX: processing request error, remote=10.76.40.175:52880, err=panic: [happened in biz handler] runtime error: invalid memory address or nil pointer dereference
goroutine 114 [running]:
runtime/debug.Stack(0xbc3655, 0x1c, 0xc0003d3560)
        /usr/local/go/src/runtime/debug/stack.go:24 +0x9d
xxx/kitex/server.(*server).invokeHandleEndpoint.func1.1(0xc0003d38f8, 0xcb4340, 0xc000284af0, 0xcb2000, 0xc0000987e0)
        /home/tiger/go/pkg/mod/xxx/kitex@v1.1.10/server/server.go:196 +0x141
panic(0xaec120, 0x1172dd0)
        /usr/local/go/src/runtime/panic.go:969 +0x166
main.(*EchoServerImpl).Echo(0x11b54b0, 0xcb2000, 0xc0000987e0, 0xc000283d40, 0x11b54b0, 0xc0003aca28, 0xcaef01)
        /home/tiger/go/src/xxx/performancetest/handler.go:18 +0x6d
xxx/performancetest/kitex_gen/echo/echoserver.echoHandler(0xcb2000, 0xc0000987e0, 0xadc1c0, 0x11b54b0, 0xb7dd80, 0xc000286520, 0xb7dec0, 0xc000286528, 0xc0000986f0, 0xae9c60)
        /home/tiger/go/src/xxx/performancetest/kitex_gen/echo/echoserver/echoserver.go:37 +0xa4
In the given panic stack, 0x0 was not found. Therefore, we directly examine the relevant code in handler.go:18.
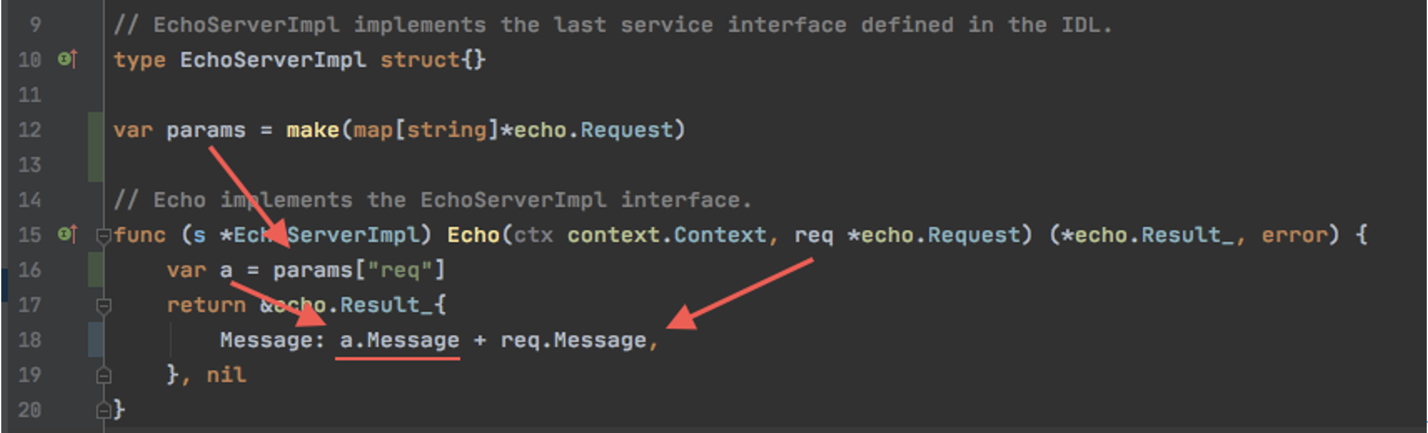
On line 18, two parameters, a and req, are used. Since req is a passed parameter and is not 0x0, we can exclude it as a potential nil value. Thus, the nil pointer must be a.
By further reviewing the code, we can conclude that a is accessed without a nil pointer check, leading to the introduction of a nil pointer panic.
Concurrent Operations on Maps
Concurrent operations on maps can lead to irrecoverable errors, causing the system to crash without the possibility of recovery.
There is no quick way to locate the issue. The suggestion is to first identify the map that triggers the error, and then examine the locations where concurrent operations on this map occur. Adding locks or redesigning the logic can help resolve the concurrency issue.
Business Logic Leading to Framework Panic
Why Does Business Logic Cause Framework Panic?
Some panics are indeed thrown by the framework’s middleware (MW). However, in most cases, it is not a bug in the framework itself, but rather the framework encountering exceptional values passed by the business logic.
The middleware (MW) of the framework wraps around the outermost layer of the code logic. Certain behaviors in the business code, such as passing a nil request or returning a nil response, can cause the framework to panic during processing.
However, the framework cannot handle and recover from such panics because it is not omnipotent. Dealing with boundary conditions would consume computational resources, and the framework expects the business code to maintain a certain level of quality. Therefore, ultimately, it is the responsibility of the business code to make adjustments to address these panics.
How to Determine if it is Business Logic Causing the Framework Panic
If the error stack includes calls to business code, first investigate whether the panic is caused by the business’s return values.
Common scenarios include:
- Custom middleware in the business code that modifies the passed parameters, leading to a panic.
- Returning custom
responseorerrorobjects from the business code. - … (Additional scenarios may exist)
Special Cases
Concurrent/Asynchronous Reuse of Request/Response in RPC Calls Leading to Panic
A typical panic error message is:
runtime error: slice bounds out of range [12:28]. This occurs because the data is modified concurrently, resulting in inconsistencies, which in turn leads to out-of-bounds access during read or write operations by the framework.- For example, if a
slicewith a length of 5 is passed to the framework, but due to concurrent reuse, it is updated to aslicewith a length of 8. If the framework performs a read or write operation at the moment when only the length is copied, this problem can occur due to concurrent modifications.
- For example, if a
When invoking the framework, there is a risk of concurrent read and write to the
requestdata if another goroutine uses the samerequest(including its fields) before the invocation is completed.- The framework’s RPC timeout design follows the classic
select-waitpattern, where the current goroutine waits for another goroutine, created to handle serialization and network transmission, to complete within a specific timeout period. If the latter does not return within the specified time, the former directly returns a timeout error to the caller, while the latter may still be performing read or write operations on therequest.
- The framework’s RPC timeout design follows the classic
Additionally, pooling of
requestandresponseobjects or creating multiple goroutines that access the same object can also lead to issues.Here are a few examples:
// example 1: Concurrent read and write due to reusing the same request or response
var cli := ...
var ctx := ...
var req := ...
for {
    resp, err := cli.InvokeAMethod(ctx, req)
    req.ID++ // There is a risk of concurrent read and write if err != nil
}

// example 2: Concurrent read and write due to pooling of request or response
var pool sync.Pool = ...
for {
    req := pool.Get().(*SomeRequest)
    cli.InvokeAMethod(ctx, req)
    pool.Put(req) // The request put into the pool may still be referenced by the framework
}

// example 3: Direct concurrent read and write
var req := ...
go func() {
    cli.InvokeAMethod(ctx, req)
}()

go func() {
    cli.InvokeAMethod(ctx, req) // Data race with the previous goroutine
}()
Common panic locations (including but not limited to):
FastWriteorFastWriteNocopymethods of theRequesttypeFastReadmethod of theResponsetype
If a
FastRead panicoccurs on the server-side, and external factors such asbytediffor traffic replay/modification by proxy are ruled out, one possible reason is concurrent read and write operations on the upstream data, leading to corrupted serialized data, which affects the server-side deserialization.FastWritemethod of theResponsetype
Asynchronous Use of RPCInfo
Panic occurs when attempting to access data such as RPCInfo outside of the handler method by passing the context parameter of the handler.
Known Panics Resolved by Upgrading the Framework Version
(<
v0.4.1may trigger) Panic during shutdown when the server fails to startThe root cause is not a panic caused by the framework itself but rather the failure of the server to start due to reasons such as the port being occupied. When the server is shutdown, it triggers a panic in Kitex, which may replace the log message indicating the actual cause, making it difficult to identify the original reason. The fix PR: #488.
(<
v0.2.0may trigger) Enable retry and panic stack containsfastReadThis may be a bug in earlier versions. Upgrading to a newer version may resolve the issue.