Memory Leak Self-Check Guide
The framework helps users create Request/Response objects, and if users hold onto these objects without releasing them, it can lead to a continuous increase in memory usage. However, when using go pprof heap, it only shows which functions created the leaked objects and doesn’t track who is holding onto those objects. Users might mistakenly think that the framework is causing the memory leak, but in reality, it is not caused by the framework.
This document provides guidance for users to perform a self-check to identify memory leak points. If the examples in this document don’t match your situation, please submit an issue on the corresponding project repository on GitHub, and the community maintainers will follow up and address it promptly.
How to interpret Go pprof heap
Skip this section if you are already familiar with it.
Check which function allocated the most memory -
alloc_space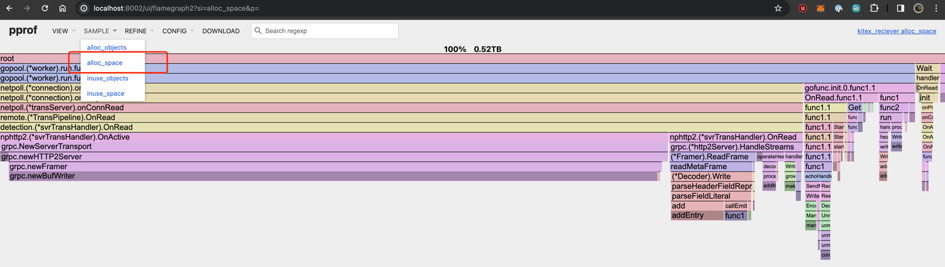
Check which function created the most objects -
alloc_objects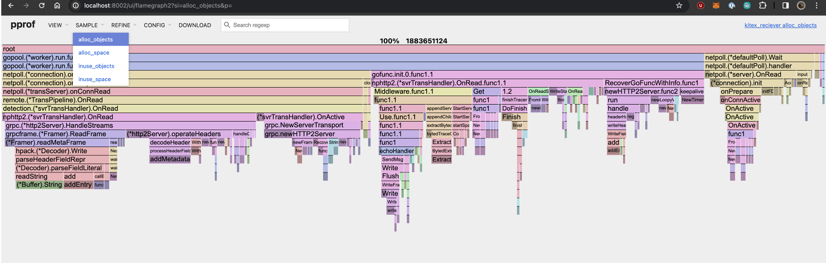
Check which function created the most persistent objects in terms of memory usage -
inuse_space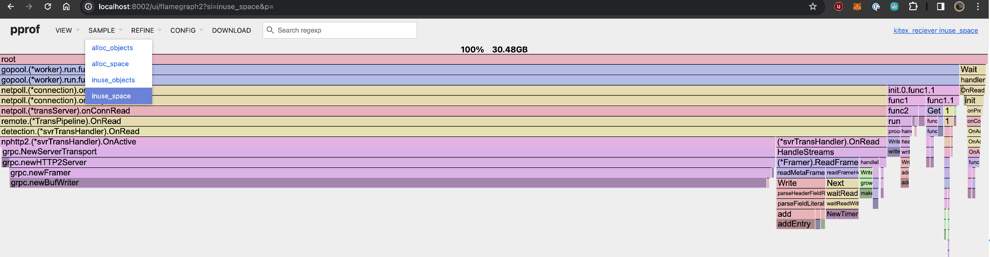
Principles and Caveats of Pprof Heap
The implementation principle of Go pprof heap is to insert code during each malloc/free operation and trace the current stacktrace to determine how much memory each function allocated (alloc) and freed (free), thus calculating inuse=(alloc-free).
In most cases, this logic works fine. However, in Netpoll and Kitex, there is a lot of memory reuse happening, which means that “functions that actually allocate objects from the pool are not responsible for creating the objects.” Therefore, you won’t see this part being counted in the pprof heap.
But in general, the business logic rarely involves such operations, so it doesn’t affect the analysis in the vast majority of cases.
Server Memory Leak
Increased Connection Count + Large Payload Scenarios
In the past, Netpoll had a barriers variable internally, which temporarily stored some buffers across connections. If the number of connections increased, it would lead to its capacity expansion, and then there would be lingering buffer references from historical connections, resulting in memory leaks.
This issue was fixed in Netpoll v0.2.5. Upgrade to Kitex >= v0.3.3 to resolve it.
Strictly speaking, even for small payloads, there may be some leakage cases, but they are not significant (e.g., 10MB leakage for 10,000 connections, each with 1KB). Therefore, it is generally difficult to detect and has no significant impact. In scenarios with large payloads and a large number of connections created in the past, the memory leak becomes more noticeable.
Typical Profile Symptoms
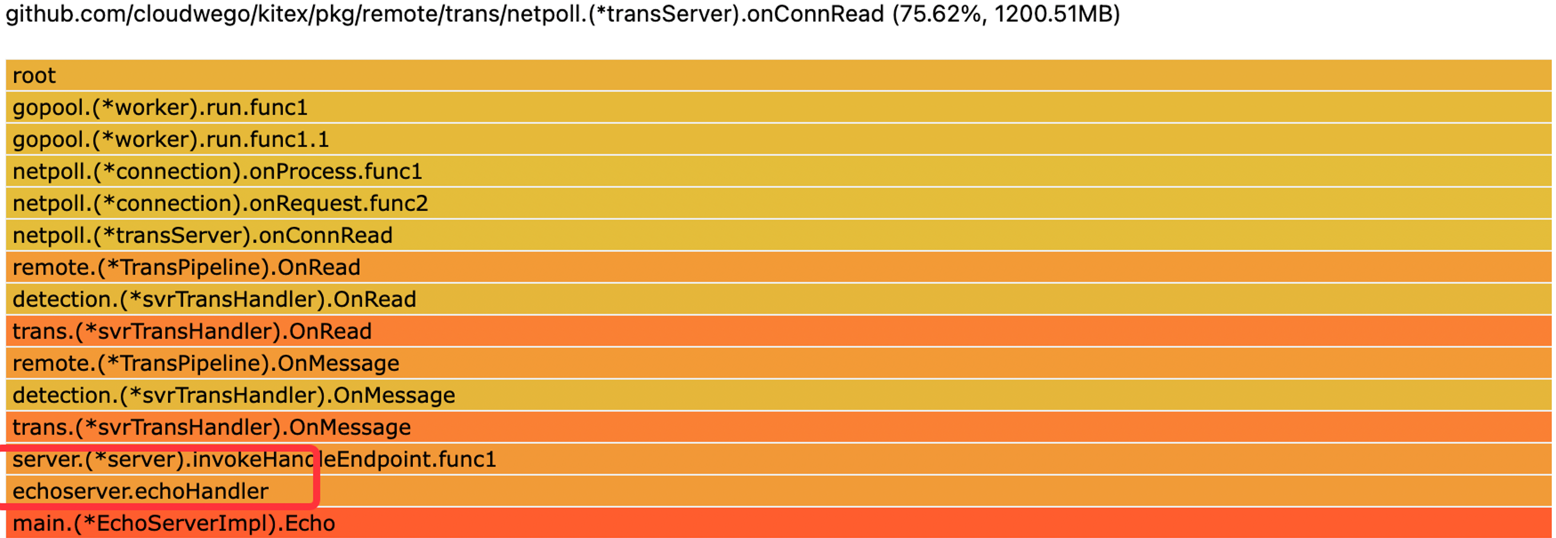
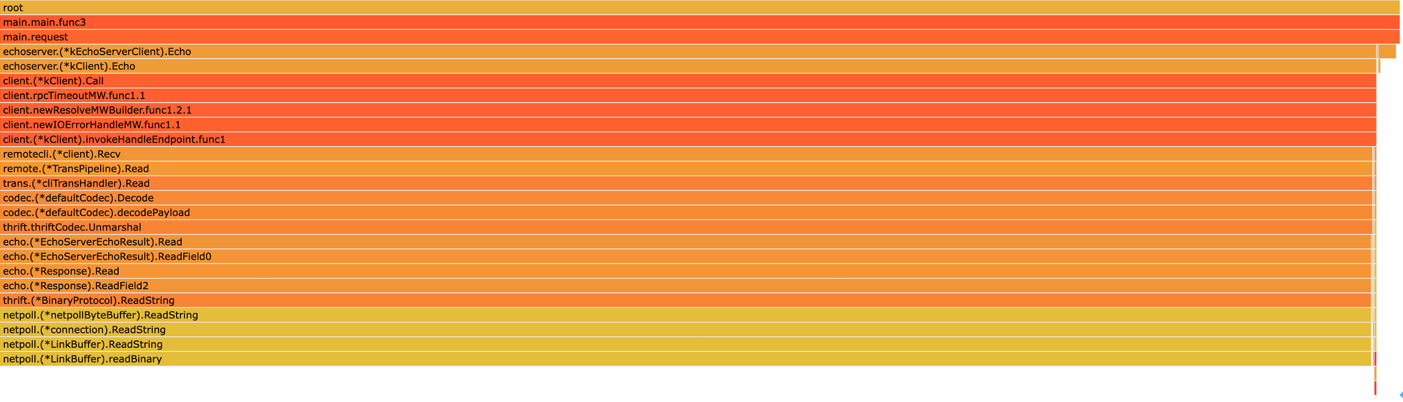
Server Request Leak: Large incoming request size
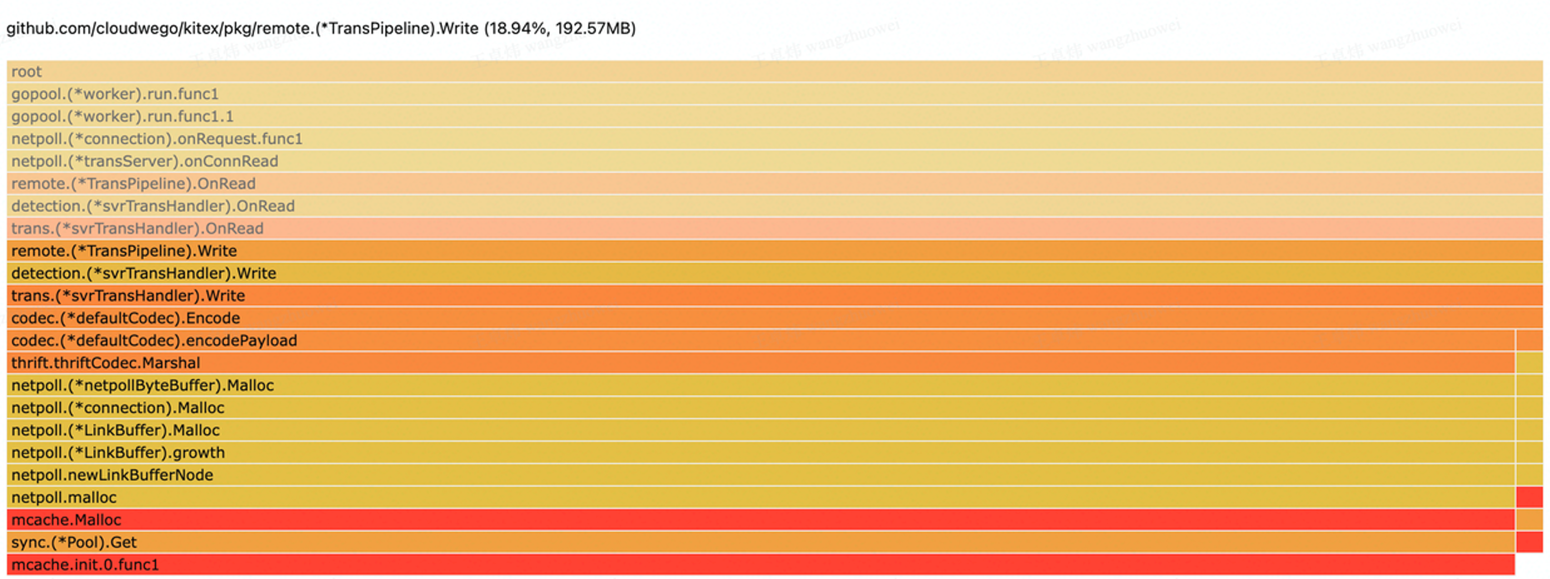
Server Response Leak: If a field supports NoCopy serialization, the memory will appear to be created within the business handler.
Server Response Leak: If a field does not support NoCopy serialization, the memory will appear to be created during the serialization process.
Holding onto a Field of Request Object Persistently
Typical code:
Note that for
[]byteorstringtypes, even holding a partial slice of an object will still keep the entire underlying memory referenced.
func (s *EchoServerImpl) Echo(ctx context.Context, req *echo.Request) (*echo.Response, error) {
   // memory leak
   cache.Store(req.Id, req.Msg[:1])
   resp := &echo.Response{}
   return resp, nil
}
By following the stack trace above, you can see that there is a memory leak in Request.Field2. Then you can check which field has the tag number 2 in the IDL file and search for the leak point in the code.
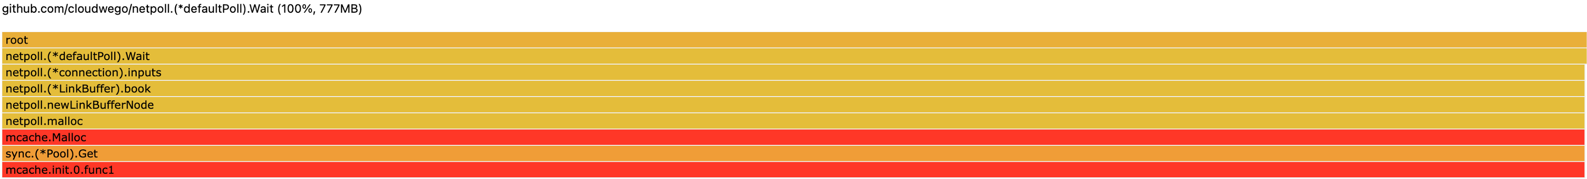
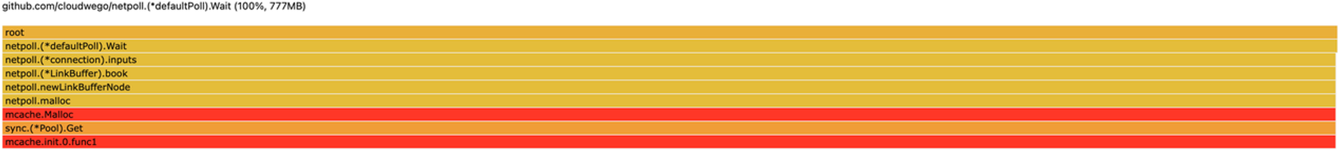
Excessive Creation of Idle Connections
Netpoll creates an initial-sized buffer for each connection. If the upstream continuously creates connections, it may appear as if Netpoll is occupying all the downstream memory.
Large Request with Abnormal Size
First, make sure that github.com/cloudwego/netpoll is >= v0.2.5 or Kitex >= v0.3.3. If not, it could be the bug mentioned earlier, caused by a sudden increase in the number of connections.
Strictly speaking, this case is not considered a memory leak. However, Netpoll will cache (sync.Pool) some memory for these abnormally sized requests, resulting in increased memory usage. Even without caching, these abnormally sized requests themselves require a large amount of memory and pose a risk.
Typical profile:
Common scenarios:
- Abnormally large field in the upstream.
- Upstream or upstream’s upstream transmitting a very large value. For example, some businesses like to transmit large volumes of debug info, or they use transmission to fulfill requirements not defined in the IDL.
Resolution: Identify the source of abnormally sized requests through packet capture and ask the other party to modify such usage.
Client Memory Leak
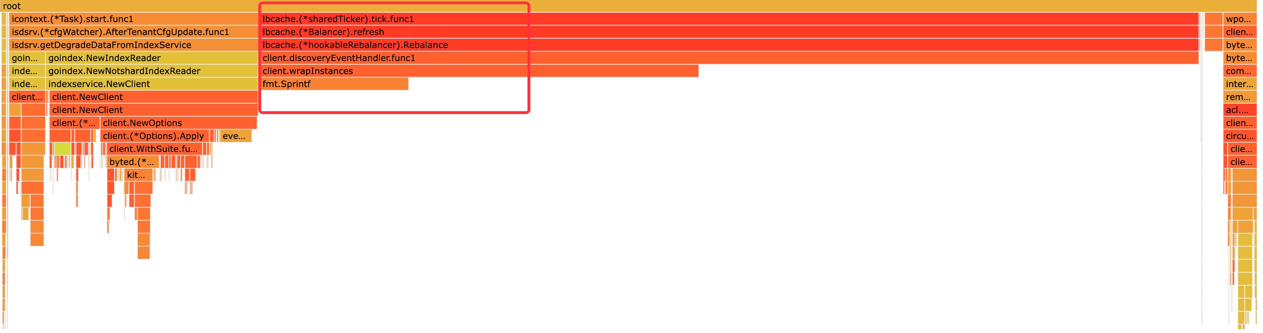
High Memory Usage of lbcache
lbcache is only created once for each client. If there is a large amount of lbcache leakage, it indicates that there is likely a behavior of creating a large number of duplicate clients.
Persistent Holding of a Field in Response
Typical code: continuously holding a reference to a field in response, even if it’s just one byte.
resp, err := cli.Echo(context.Background(), req)
if err != nil {
   return
}
cache.Store(resp.Id, resp.Msg[:1])
Caching Objects by Parsing String Fields in Request/Response Using Sonic
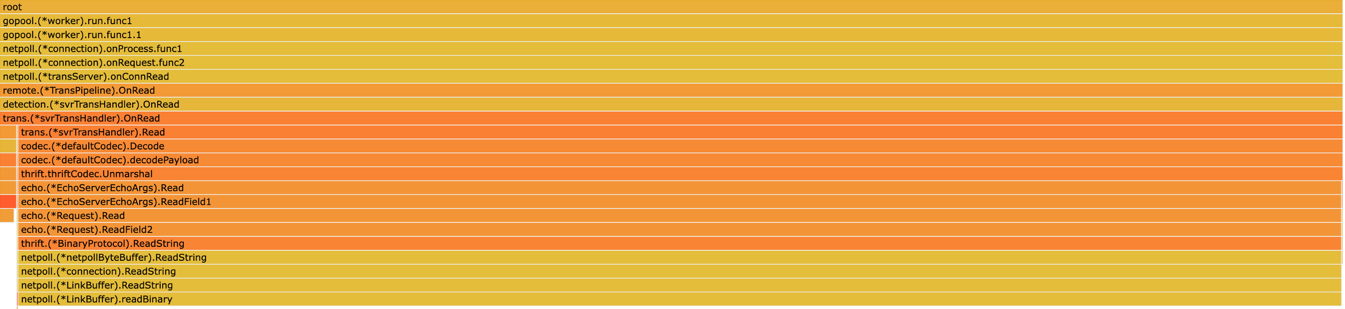
Typical profile:
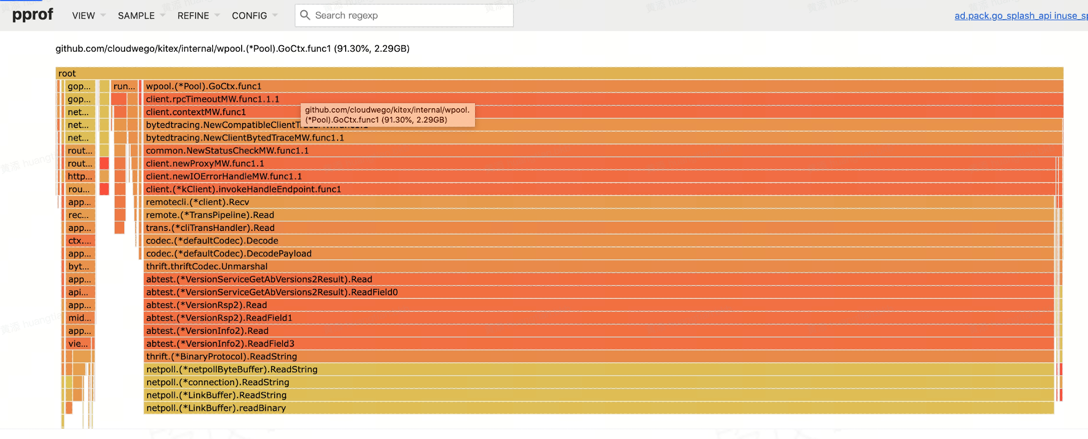
Typical triggering scenarios:
- There is a large
stringobject in theRequest/Response - Using Sonic to unmarshal this
stringobject.
Solution: Enable the CopyString option in Sonic.
Reason for the issue:
- For performance reasons, Sonic reuses the underlying memory of the input
stringfor unmarshaledstringobjects. If the service is used to parse large JSON and cache the parsed objects or if there are multiple goroutines holding onto the parsed objects, it may result in the original inputstringobject’s memory not being released for a long time. Please refer to Sonic for more details. - Memory allocation in the
Requestis done in the netpoll function stack, so it may appear that the objects created by netpoll are leaking memory. In reality, it is unrelated to netpoll.
However, the root cause is still that there is a place in the business code that persistently holds the object after Sonic unmarshalling. This only amplifies the impact of the leak, and the solution mentioned above only reduces the impact of the leak.
If there is still a memory leak after applying this solution, it is necessary to carefully review the business code to identify where the objects are being persistently held.