Debug Efficiently
Troubleshooting Panic Issues
While not all panic issues are caused by concurrency, this discussion will focus on panic issues related to concurrency.
Let’s assume we have the following code. The Handle function returns the resp directly when the ctx times out. However, there is a potential concurrency issue in this function. Even after the Process function has obtained the Response variable, it is still possible for it to be modified later, resulting in a concurrency problem.
func Handle(ctx context.Context) *Response {
   done := make(chan struct{})
   resp := &Response{Data: []byte("12345")} // default value
   go func() {
      runtime.Gosched() // mock network calls
      resp.Data = nil
      close(done)
   }()

   select {
   case <-ctx.Done(): // canceled
   case <-done:
   }
   return resp
}

func Process(ctx context.Context) {
   resp := Handle(ctx)
   size := len(resp.Data)
   if size > 0 {
      runtime.Gosched()
      fmt.Println(resp.Data[:size])
   }
}
Troubleshooting with the Stack Trace
The stack trace for the code above, when encountering a concurrency conflict, is as follows:
panic: runtime error: slice bounds out of range [:5] with capacity 0 [recovered]
        panic: runtime error: slice bounds out of range [:5] with capacity 0

goroutine 6 [running]:
testing.tRunner.func1.2(0x113c6c0, 0xc00008c000)
        /usr/local/go/src/testing/testing.go:1144 +0x332
testing.tRunner.func1(0xc000001380)
        /usr/local/go/src/testing/testing.go:1147 +0x4b6
panic(0x113c6c0, 0xc00008c000)
        /usr/local/go/src/runtime/panic.go:965 +0x1b9
chore/example.Process(0x1178d68, 0xc000022480)
        /Users/bytedance/Code/go/chore/example/panic_test.go:36 +0xf8
chore/example.TestPanic(0xc000001380)
        /Users/bytedance/Code/go/chore/example/panic_test.go:44 +0x85
testing.tRunner(0xc000001380, 0x11557f8)
        /usr/local/go/src/testing/testing.go:1194 +0xef
created by testing.(*T).Run
        /usr/local/go/src/testing/testing.go:1239 +0x2b3
Identifying the Panic Cause
First, we need to determine the actual cause of the panic. You can find it at the topmost line of the complete panic stack, which in this case is
panic: runtime error: slice bounds out of range [:5] with capacity 0 [recovered].Locating the Original Panic Location
Second, we need to find the code line where the panic is triggered. Any panic stack will include at least one log entry from
runtime/panic.go, and the next entry after that will indicate the actual line of code that triggered the panic. In this case, it isexample/panic_test.go:36.However, sometimes a user’s panic is wrapped by a higher-level recover function, like this:
func WrapPanic(ctx context.Context) {
   defer func() {
      err := recover()
      if err != nil {
         panic(err)
      }
   }()
   Process(ctx)
}
In this case, the panic will appear as follows:
panic: runtime error: slice bounds out of range [:5] with capacity 0 [recovered]
        panic: runtime error: slice bounds out of range [:5] with capacity 0 [recovered]
        panic: runtime error: slice bounds out of range [:5] with capacity 0

goroutine 18 [running]:
testing.tRunner.func1.2(0x113c7c0, 0xc00011c000)
        /usr/local/go/src/testing/testing.go:1144 +0x332
testing.tRunner.func1(0xc000082600)
        /usr/local/go/src/testing/testing.go:1147 +0x4b6
panic(0x113c7c0, 0xc00011c000)
        /usr/local/go/src/runtime/panic.go:965 +0x1b9
chore/example.WrapPanic.func1()
        /Users/bytedance/Code/go/chore/example/panic_test.go:47 +0x55
panic(0x113c7c0, 0xc00011c1. The panic cause is a "slice bounds out of range" error with a capacity of 0.
The order of the panic stack trace goes from top to bottom, with the outermost function calls at the bottom. We need to find the first place where panic() is called, so we need to look for the bottommost section of runtime/panic.go, and the line below it indicates the actual code line where the panic is triggered.
Tracing through Race Conditions
Continuing with the example code, in cases where the codebase is extensive, especially when involving third-party libraries, it becomes challenging to visually determine which asynchronous logic is modifying a variable. In such situations, we need to rely on tools to identify the root cause for us.
Debugging with Unit Tests
For scenarios where the modification logic is contained within the same function, we can write a simple unit test to uncover the issue:
func TestPanic(t *testing.T) {
   ctx, cancelFn := context.WithTimeout(context.Background(), time.Millisecond)
   cancelFn() // ctx is done
   Process(ctx)
}
We can then run the test function with race detection enabled using go test -race ./panic_test.go. Go will output logs indicating which goroutines are concurrently reading or writing to which variables, along with the creation location of these goroutines:
WARNING: DATA RACE
Write at 0x00c000124030 by goroutine 8:
  command-line-arguments.Handle.func1()
      /Users/bytedance/Code/go/chore/example/panic_test.go:21 +0x44

Previous read at 0x00c000124030 by goroutine 7:
  command-line-arguments.Process()
      /Users/bytedance/Code/go/chore/example/panic_test.go:35 +0x5b
  command-line-arguments.WrapPanic()
      /Users/bytedance/Code/go/chore/example/panic_test.go:50 +0x6c
  command-line-arguments.TestPanic()
      /Users/bytedance/Code/go/chore/example/panic_test.go:56 +0x9a
  testing.tRunner()
      /usr/local/go/src/testing/testing.go:1194 +0x202

Goroutine 8 (running) created at:
  command-line-arguments.Handle()
      /Users/bytedance/Code/go/chore/example/panic_test.go:19 +0x116
  command-line-arguments.Process()
      /Users/bytedance/Code/go/chore/example/panic_test.go:34 +0x46
  command-line-arguments.WrapPanic()
      /Users/bytedance/Code/go/chore/example/panic_test.go:50 +0x6c
  command-line-arguments.TestPanic()
      /Users/bytedance/Code/go/chore/example/panic_test.go:56 +0x9a
  testing.tRunner()
      /usr/local/go/src/testing/testing.go:1194 +0x202

Goroutine 7 (finished) created at:
  testing.(*T).Run()
      /usr/local/go/src/testing/testing.go:1239 +0x5d7
  testing.runTests.func1()
      /usr/local/go/src/testing/testing.go:1512 +0xa6
  testing.tRunner()
      /usr/local/go/src/testing/testing.go:1194 +0x202
  testing.runTests()
      /usr/local/go/src/testing/testing.go:1510 +0x612
  testing.(*M).Run()
      /usr/local/go/src/testing/testing.go:1418 +0x3b3
  main.main()
      _testmain.go:43 +0x236
Based on the race report above, we can gather the following information:
- Goroutine 8 has a race condition write at panic_test.go:21.
- Goroutine 7 has a race condition read at panic_test.go:35.
- Goroutine 7 has finished, but Goroutine 8 is still running.
With this information, we can generally identify the root cause of the issue.
Debugging in Production
Sometimes, it is not feasible to write unit tests for certain business logic, especially when it involves collaborative interactions between multiple upstream and downstream services to trigger the specific logic. In such cases, we need to rely on debugging in a production environment to identify the problem.
Suppose we have the following code:
type Request struct {
   Id int
}

type Response struct {
   Data []byte
}

//go:noinline
func RPCCall(req *Request) *Response {
   resp := &Response{Data: []byte("hello")}
   if req.Id%100 == 0 { // Logic Bug
      go func() {
         resp.Data = []byte("world")
      }()
   }
   return resp
}

func main() {
   for id := 0; ; id++ {
      resp := RPCCall(&Request{Id: id})
      if string(resp.Data) != "hello" {
         log.Println("abnormal response!")
         return
      }
   }
}
The RPCCall function simulates a race condition bug that only occurs for specific parameters in a production request. We can compile this program using go build -race.
It’s important tonote that this compilation method significantly reduces program performance. If possible, it’s recommended to have an environment for traffic replay, where you can replay production traffic on a specific instance to reproduce the problem. If traffic replay is not available, you can enable race detection on a few selected instances, but be prepared for potential timeouts due to decreased performance.
Troubleshooting Crash Issues
In Go, there are generally two reasons for an unexpected process exit:
- Unrecovered panic: A panic error occurs in a Goroutine and is not recovered.
- Unexpected exception: The Go runtime encounters a fatal error that cannot be recovered, such as concurrent map writes or accessing an illegal address.
By default, Go prints the corresponding stack trace for all exceptional exits. For simple projects, you can use the same stack tracing methods as for troubleshooting panic issues to locate the problem. However, for complex projects, even if you can identify the location of the exit, it is still difficult to determine why the code reached that point. In such cases, you need tools that can provide detailed analysis of the system’s state at the time of the crash.
In C/C++, GDB is commonly used for this type of debugging. In Go, we can use Delve, a debugger specifically designed to optimize Go runtime features and data structures.
Obtaining a Coredump File
Passive Retrieval
Delve requires the coredump file saved when the process exits. To obtain it, we need to use the following steps:
# Remove the size limit for coredump files
ulimit -c unlimited

# Check the coredump file directory
# For machines controlled by the company, this directory is usually specified as /opt/tiger/cores.
cat /proc/sys/kernel/core_pattern

# Instruct the Go runtime to handle coredump files
GOTRACEBACK=crash ./{bin_exec}
Note that Go does not produce a coredump file for panics that are recovered.
Active Retrieval
Furthermore, it is not necessary to wait for the program to exit to generate a coredump file. If we suspect that a program has entered an exceptional state (e.g., it is stuck) but has not exited abnormally, we can proactively send a core signal to generate the coredump file and save the state:
# Force the generation of a coredump file
apt install gdb
gcore -o server.coredump {pid} # gcore temporarily stops the program from responding, but does not kill it
Analyzing with Delve
Let’s use the following example code, which occasionally crashes, to demonstrate how to use Delve for in-depth analysis:
package main

import (
   "fmt"
   "log"
   "sync"
)

var _ error = (*MyError)(nil)
var store sync.Map

func init() {
   for id := 0; id < 1000; id++ {
      item := &Item{Name: fmt.Sprintf("Item-%d", id)}
      store.Store(id, item)
   }
}

type MyError struct {
   Reason string
}

func (e MyError) Error() string {
   return fmt.Sprintf("MyError: %s", e.Reason)
}

func Buy(id int) (*Item, error) {
   var err *MyError
   val, ok := store.LoadAndDelete(id)
   if !ok {
      return nil, err
   }
   item := val.(*Item)
   return item, err
}

func Handler(id int) {
   item, err := Buy(id)
   if item == nil && err != nil {
      if merr, ok := err.(*MyError); ok {
         log.Printf("Buy[%d] get error: %v", id, merr.Error())
      }
      return
   }
   log.Printf("Buy item success: %v", item)
}

func main() {
   var wg sync.WaitGroup
   for id := 0; id < 1000; id++ {
      wg.Add(1)
      go func() {
         defer wg.Done()
         log.Printf("Handling: %d", id)
         Handler(id)
      }()
   }
   wg.Wait()
}

type Item struct {
   Name string
}
In this program, the init function creates 1000 items of type Item in the store variable. In the main function, 1000 Goroutines are used to concurrently call the Buy function to retrieve items from the store. Since various exceptional conditions can occur during the purchase process, we encapsulate the failure reason using the MyError type.
During the program’s execution, it may panic with the following error and exit:
panic: runtime error: invalid memory address or nil pointer dereference
[signal SIGSEGV: segmentation violation code=0x1 addr=0x0 pc=0x491101]

goroutine 48 [running]:
panic({0x49c4e0, 0x53e0b0})
        /usr/local/go/src/runtime/panic.go:941 +0x397 fp=0xc00004ad50 sp=0xc00004ac90 pc=0x437337
runtime.panicmem(...)
        /usr/local/go/src/runtime/panic.go:220
runtime.sigpanic()
        /usr/local/go/src/runtime/signal_unix.go:826 +0x31d fp=0xc00004ada0 sp=0xc00004ad50 pc=0x44be1d
main.Handler(0x39)
        /home/wangzhuowei/code/chore/main.go:41 +0x121 fp=0xc00004aef8 sp=0xc00004ada0 pc=0x491101
main.main.func1()
        /home/wangzhuowei/code/chore/main.go:55 +0x159 fp=0xc00004afe0 sp=0xc00004aef8 pc=0x491619
runtime.goexit()
        /usr/local/go/src/runtime/asm_amd64.s:1571 +0x1 fp=0xc00004afe8 sp=0xc00004afe0 pc=0x4635e1
created by main.main
        /home/wangzhuowei/code/chore/main.go:52 +0xf1
If you have a certain understanding of common pitfalls in Go coding, you may be able to identify several bugs lurking within the code by reading it. However, assuming that the functions here consist of complex code nested dozens of layers deep, and even involve third-party SDK handling, it becomes very difficult to troubleshoot by manually reading the code.
Identifying the Immediate Cause
Using the methods mentioned earlier, we first locate the coredump file in the local directory and then run:
dlv core {elf_exec} {coredump_file}
Once inside the coredump file, we start by typing “stack” to see where the program’s stack was when the crash occurred:
(dlv) stack
 0  0x0000000000464f01 in runtime.raise
    at /usr/local/go/src/runtime/sys_linux_amd64.s:170
 1  0x000000000044bf45 in runtime.dieFromSignal
    at /usr/local/go/src/runtime/signal_unix.go:860
 2  0x000000000044c516 in runtime.sigfwdgo
    at /usr/local/go/src/runtime/signal_unix.go:1074
 3  0x000000000044ac2a in runtime.sigtrampgo
    at /usr/local/go/src/runtime/signal_unix.go:430
 4  0x0000000000465cce in runtime.sigtrampgo
    at <autogenerated>:1
 5  0x00000000004651dd in runtime.sigtramp
    at /usr/local/go/src/runtime/sys_linux_amd64.s:363
 6  0x00000000004652e0 in runtime.sigreturn
    at /usr/local/go/src/runtime/sys_linux_amd64.s:468
 7  0x0000000000437b69 in runtime.crash
    at /usr/local/go/src/runtime/signal_unix.go:952
 8  0x0000000000437b69 in runtime.fatalpanic
    at /usr/local/go/src/runtime/panic.go:1092
 9  0x0000000000437337 in runtime.gopanic
    at /usr/local/go/src/runtime/panic.go:941
10  0x000000000044be1d in runtime.panicmem
    at /usr/local/go/src/runtime/panic.go:220
11  0x000000000044be1d in runtime.sigpanic
    at /usr/local/go/src/runtime/signal_unix.go:826
12  0x0000000000491101 in main.Handler
    at /home/wangzhuowei/code/chore/main.go:41
13  0x0000000000491619 in main.main.func1
    at /home/wangzhuowei/code/chore/main.go:55
14  0x00000000004635e1 in runtime.goexit
    at /usr/local/go/src/runtime/asm_amd64.s:1571
The leftmost number indicates the hierarchical sequence of each frame in the stack. We can use the “frame N” command to enter a specific frame and view more information:
(dlv) frame 12
> runtime.raise() /usr/local/go/src/runtime/sys_linux_amd64.s:170 (PC: 0x464f01)
Frame 12: /home/wangzhuowei/code/chore/main.go:41 (PC: 491101)
    36:
    37:        func Handler(id int) {
    38:                item, err := Buy(id)
    39:                if item == nil && err != nil {
    40:                        if merr, ok := err.(*MyError); ok {
=>  41:                                log.Printf("Buy[%d] get error: %v", id, merr.Error())
    42:                        }
    43:                        return
    44:                }
    45:                log.Printf("Buy item success: %v", item)
So far, the information we have can only tell us the direct cause of the panic, which is that “merr” inexplicably became nil at this point. In fact, this information can be obtained from analyzing the panic logs when the crash occurred. However, this information is not enough to understand what exactly happened at the scene of the incident. Therefore, we need further steps to analyze and identify the root cause of the problem.
Tracing the Root Cause
In line 41 of the code, we can see that we have taken several safety precautions to obtain the actual MyError object. We first check if it is nil, and then we check if we can perform a type conversion. However, we still encounter the error “invalid memory address or nil pointer dereference.” Therefore, our first step is to understand what merr and err variables represent in this context:
(dlv) print merr
*main.MyError nil
(dlv) print err
error(*main.MyError) nil
We can see that merr is of type pointer and has a value of nil. On the other hand, err is of type interface{}, and its display format is <interface name>(<concrete type>)<value>. Therefore, we can deduce that it is an object of type *MyError with a value of nil.
By reading the Go source code and documentation, we know that in Go, an interface object with a concrete type but a nil value is not equal to nil.
The next question is, in what scenario would err have a type but a nil value? We can search for all possible locations where var err *MyError is declared in the code, and we find the following:
func Buy(id int) (*Item, error) {
   var err *MyError
   val, ok := store.LoadAndDelete(id)
   if !ok {
      return nil, err
   }
   item := val.(*Item)
   return item, err
}
In the Buy function, it is evident that when the id object is not found in the store, it returns item as nil and err as a nil value with a non-nil type.
However, if we look at the init function at the beginning of the code, we can see that we have already created all the Item objects with IDs in the range [0, 1000), and the main function calls the Buy function with IDs in the range [0, 1000). So why would it not find a value? Therefore, we need to dig deeper into the call chain and examine all relevant variables:
(dlv) frame 13
Frame 13: /home/wangzhuowei/code/chore/main.go:55 (PC: 491619)
    50:                for id := 0; id < 1000; id++ {
    51:                        wg.Add(1)
    52:                        go func() {
    53:                                defer wg.Done()
    54:                                log.Printf("Handling: %d", id)
=>  55:                                Handler(id)
    56:                        }()
    57:                }
(dlv) print id
58

(dlv) frame 12
Frame 12: /home/wangzhuowei/code/chore/main.go:41 (PC: 491101)
    37:        func Handler(id int) {
    38:                item, err := Buy(id)
    39:                if item == nil && err != nil {
    40:                        if merr, ok := err.(*MyError); ok {
=>  41:                                log.Printf("Buy[%d] get error: %v", id, merr.Error())
    42:                        }
(dlv) print id
57
Since the Handler function only has a connection to the upper-level calling function through the id parameter, we only need to print its value. We can see that in the outer frame 13, the value of id is 58, while in the inner frame 12, its value is 57. This indicates that at the start of the Handler call, the id value is 57, but when the panic occurs, the id value has already been modified to 58. This is unexpected because it means that before calling the Handler function, it’s possible that the id has been modified, causing the inner Buy function to access an object that has already been accessed and deleted. This leads to the final error message.
Once we find this clue, we can search for the code section that modifies the id value and identify the actual problem. In this case, it is the modification of the id object at line 50, which is currently being held by other goroutines.
func main() {
   var wg sync.WaitGroup
   for id := 0; id < 1000; id++ {
      wg.Add(1)
      go func() {
         defer wg.Done()
         log.Printf("Handling: %d)
         Handler(id)
      }()
   }
   wg.Wait()
}
Investigating Memory Leak Issues
When it comes to troubleshooting memory leak issues in Go, there are two main challenges:
- Go is a garbage-collected language that doesn’t require manual management of object lifetimes. However, this also means that any code segment that potentially holds a variable for an extended period or partially holds a memory address (such as slices) can lead to memory leaks.
- Go’s pprof heap tool only reveals which functions allocate memory but does not show who still holds references to that memory. Currently, code inspection is the only way to identify the culprits.
Assuming we have the following code, which abbreviates a user’s SSH RSA key to the “xx…x” format and stores it in a cache:
var global string
var cache sync.Map

type SSHData struct {
   UserId int
   RSAKey []byte
}

func AddSSH(data *SSHData) {
   // Mask RSAKey to xx...x format
   cache.Store(data.UserId, append(data.RSAKey[:2], '.', '.', '.', data.RSAKey[len(data.RSAKey)-1]))
}

func main() {
   go func() {
      log.Println(http.ListenAndServe("localhost:6060", nil))
   }()

   global = string(make([]byte, 1024*1024*100))
   for i := 0; ; i++ {
      req := new(SSHData)
      req.UserId = i
      req.RSAKey = randBytes(2048)

      AddSSH(req)

      time.Sleep(time.Millisecond * 1)
   }
}

func randBytes(size int) []byte {
   data := make([]byte, size)
   for i := 0; i < size; i++ {
      data[i] = byte('a' + i%26)
   }
   return data
}
Identifying Leaked Objects
To begin, we access http://localhost:6060/debug/pprof/heap to take an initial heap sample, saving the result as heap.old. This provides a snapshot of the heap’s current state.
Since the code creates 100MB of data when the service starts, this initial heap profile is not very informative. We need to focus on the memory usage that increases between two heap samples taken over a specific period.
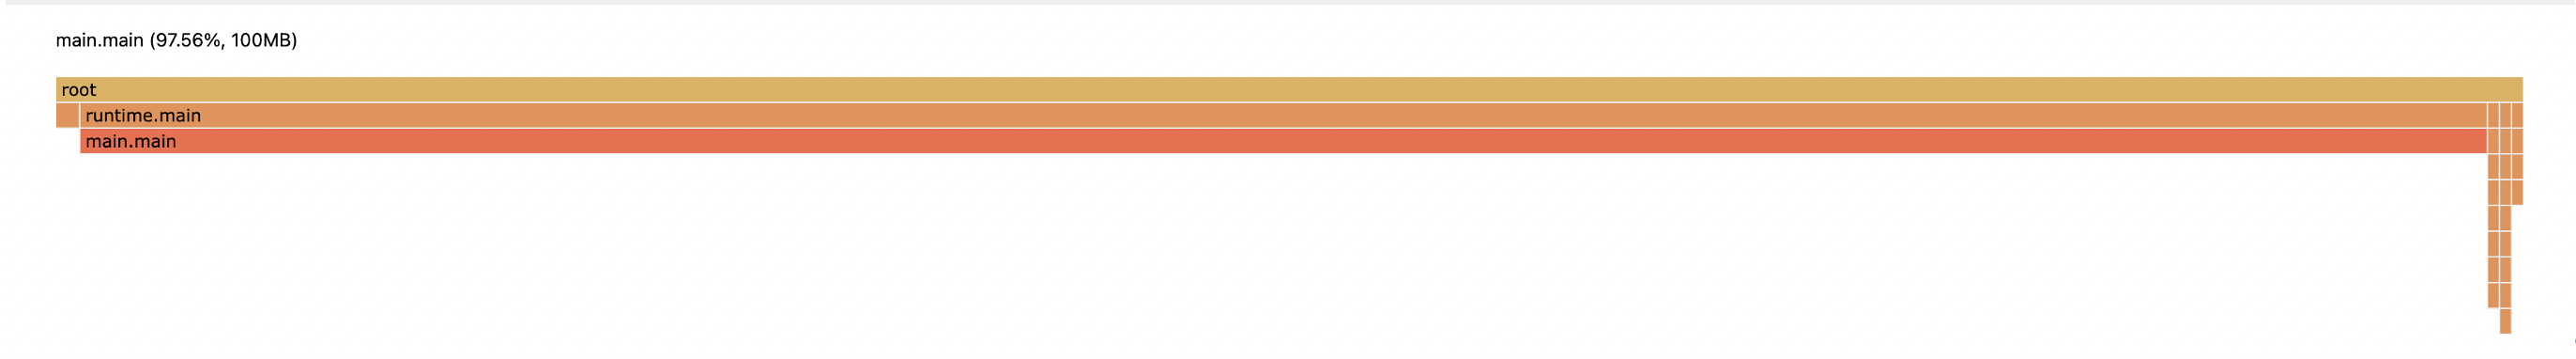
After waiting for one minute, we access the same URL to take another sample, saving the result as heap.new. We then use the command go tool pprof -http=:8000 -diff_base=heap.old heap.new to generate a heap diff graph, which visualizes the changes in memory usage.

From the generated heap diff graph, we can see that the additional memory is allocated by the randBytes function. Based on the code, it is apparent that the object referencing the return value of this function is RSAKey.
Tracing the Source of the Leak
To trace the source of the leak, we need to inspect the code and identify where the reference to the leaked object is retained. In this example, the only function that persists such a reference is:
func AddSSH(data *SSHData) {
   cache.Store(data.UserId, append(data.RSAKey[:2], '.', '.', '.', data.RSAKey[len(data.RSAKey)-1]))
}
According to the code, this function stores a 6-byte object in the cache map for each UserId. Since the main function calls AddSSH 1000 times per second, it results in a memory leak of 6KB per second. Even if the program runs for an hour, it would only leak 21MB of data, which is insufficient to account for a 60MB leak within a minute.
However, upon closer examination of the append function, we discover that the returned slice object still holds a reference to the underlying array created by the original randBytes function. As long as there is a partial reference to the slice, the original object cannot be fully released.